Clarksville: Fire Incidents, Indiana (IN)
Where are fire incidents reported in Clarksville, IN
Something went wrong! Please refresh the page.
| Fire incidents reported | |
|---|---|
| Sreet name | Count |
| LEWIS & CLARK PKY | 186 |
| GREENTREE BLVD | 130 |
| EASTERN BLVD | 126 |
| VETERANS PKY | 102 |
| I-65 | 58 |
| HIGHWAY 131 | 54 |
| MARLOWE DR | 50 |
| RIVERSIDE DR | 36 |
| HARRISON AVE | 34 |
| STANSIFER AVE | 34 |
| GUTFORD RD | 32 |
| HIGHWAY 31 | 32 |
| RANDOLPH AVE | 30 |
| WALL ST | 30 |
| YALE DR | 28 |
| FRANCIS AVE | 26 |
| HARVARD DR | 26 |
| DARTMOUTH DR | 24 |
| GREENTREE NORTH | 24 |
| BLACKISTON MILL RD | 22 |
| BROADWAY ST | 22 |
| CLARK BLVD | 22 |
| HIGHWAY31 | 20 |
| CEDAR ST | 18 |
| EMERY LANE | 18 |
| MCCULLOCH PIKE | 18 |
| APPLEGATE LANE | 16 |
| I-265 | 16 |
| OAK ST | 16 |
| PRINCETON DR | 16 |
2002 - 2017 National Fire Incident Reporting System (NFIRS) incidents
- Incident types reported to NFIRS in Clarksville, IN
- 1,15830.9%Fire
- 95725.6%Hazardous Condition
- 90324.1%Rescue & EMS
- 38610.3%False Alarm
- 2205.9%Good Intent Call
- 782.1%Service Call
- 230.6%Special Incident
- 140.4%Overpressure Rupture
- 60.2%Severe Weather
- Fire incident types reported to NFIRS in Clarksville, IN
- 48341.7%Outside Fires
- 34329.6%Structure Fires
- 22219.2%Mobile Property/Vehicle Fires
- 1109.5%Other
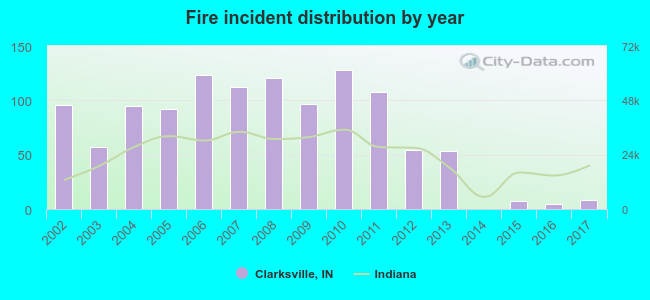 Based on the data from the years 2002 - 2017 the average number of fire incidents per year is 72. The highest number of reported fires - 128 took place in 2010, and the least - 0 in 2014. The data has a declining trend.
The average number of yearly fire incidents per 10k residents in Clarksville, IN compared to nearest cities:
(Note: Based on data for the last 3 years, including only cities with population 5,000 and above)
| Clarksville: | 2.3 |
| Jeffersonville: | 15.8 |
| New Albany: | 19.7 |
| Sellersburg: | 36.8 |
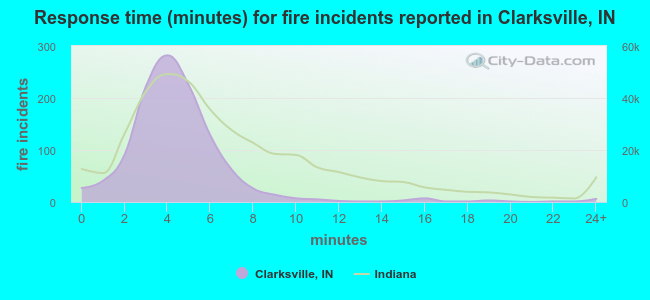 The median response time based on all reported fire incidents is 4 minutes. This is lower than the Indiana median value.
The median response time in Clarksville, IN compared to nearest cities:
(Note: Based on data for all years, including only cities with at least 500 fire incidents)
| Clarksville: | 4 minutes |
| Jeffersonville: | 4 minutes |
| New Albany: | 4 minutes |
| Sellersburg: | 6 minutes |
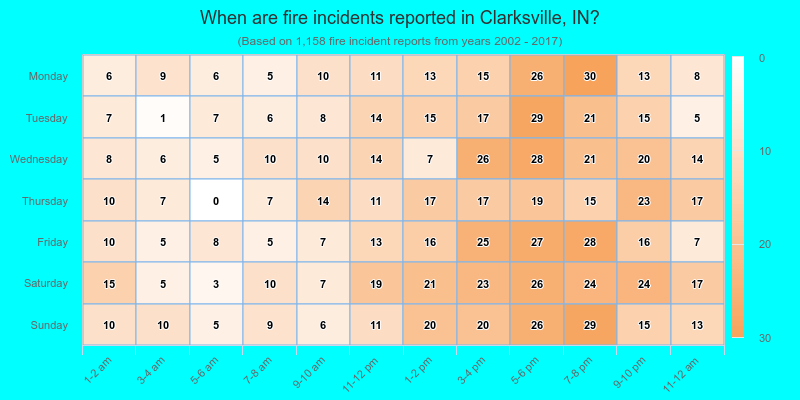
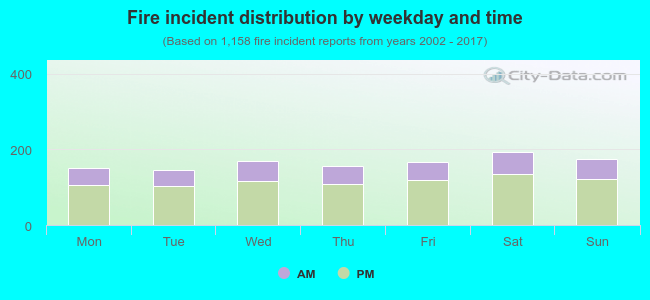 30.2% incidents where reported in the morning and 69.8% in the evening. The most fires (16.8%) took place on Saturday, and the least (12.5%) on Tuesday.
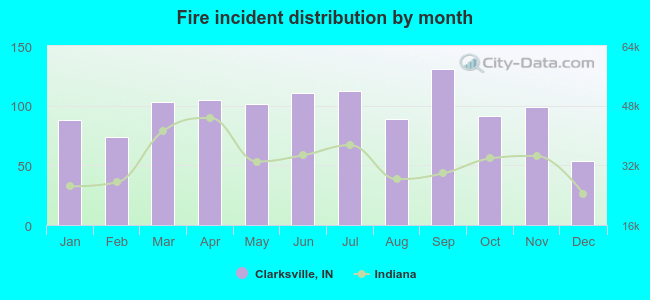 Based on the 1,158 reports from years 2002 - 2017 most fires (11.3%) took place during September, and the least (4.7%) in December.
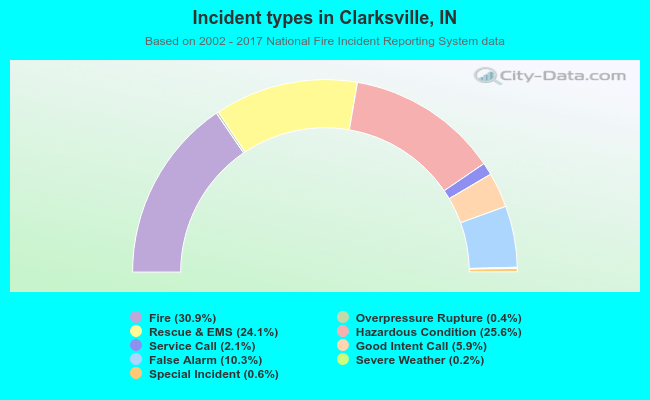 Out of all 3,745 cases reported during the years 2002 - 2017, the most belonged to the categories: Fire (30.9%), Hazardous Condition (25.6%), and Rescue & EMS (24.1%).
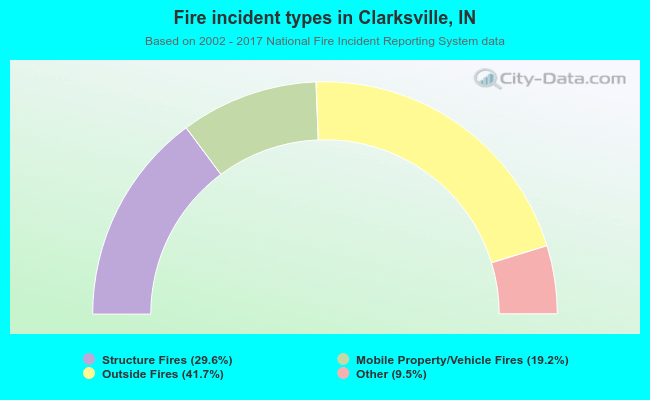 When looking into fire subcategories, the most reports belonged to: Outside Fires (41.7%), and Structure Fires (29.6%).