Clovis: Fire Incidents, California (CA)
Where are fire incidents reported in Clovis, CA
Something went wrong! Please refresh the page.
| Fire incidents reported | |
|---|---|
| Sreet name | Count |
| SHAW AVE | 322 |
| MINNEWAWA AVE | 176 |
| HERNDON AVE | 160 |
| VILLA AVE | 158 |
| CLOVIS AVE | 144 |
| WILLOW AVE | 138 |
| SHAW | 134 |
| BULLARD AVE | 126 |
| SANTA ANA AVE | 126 |
| BARSTOW AVE | 122 |
| AUBERRY RD | 118 |
| ASHLAN AVE | 106 |
| HERNDON | 104 |
| PEACH AVE | 98 |
| FOWLER AVE | 96 |
| SUNNYSIDE AVE | 94 |
| LOCAN AVE | 88 |
| TOLLHOUSE RD | 86 |
| GETTYSBURG AVE | 80 |
| ALAMOS AVE | 68 |
| BULLARD | 58 |
| SYLMAR AVE | 58 |
| ARMSTRONG AVE | 56 |
| SAN GABRIEL AVE | 52 |
| SUNNYSIDE | 52 |
| WILLOW | 52 |
| ALLUVIAL AVE | 50 |
| ASHLAN | 50 |
| POLLASKY AVE | 48 |
| MINNEWAWA | 46 |
| Other | 553 |
2005 - 2018 National Fire Incident Reporting System (NFIRS) incidents
- Incident types reported to NFIRS in Clovis, CA
- 23,86960.1%Rescue & EMS
- 7,11317.9%Good Intent Call
- 3,6199.1%Fire
- 2,2115.6%False Alarm
- 1,8094.6%Hazardous Condition
- 1,0852.7%Service Call
- Fire incident types reported to NFIRS in Clovis, CA
- 1,48140.9%Outside Fires
- 1,44239.8%Structure Fires
- 54215.0%Mobile Property/Vehicle Fires
- 1544.3%Other
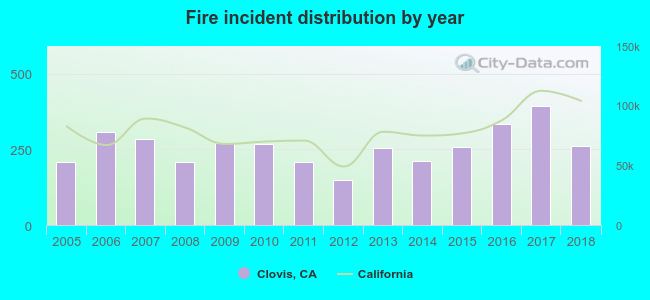 According to the data from the years 2005 - 2018 the average number of fires per year is 258. The highest number of reported fires - 395 took place in 2017, and the least - 148 in 2012. The data has a rising trend.
The average number of yearly fire incidents per 10k residents in Clovis, CA compared to nearest cities:
(Note: Based on data for the last 3 years, including only cities with population 5,000 and above)
| Clovis: | 32.3 |
| Fresno: | 73.2 |
| Sanger: | 67.4 |
| Fowler: | 80.0 |
| Parlier: | 45.4 |
| Selma: | 122.0 |
| Reedley: | 26.7 |
| Kerman: | 52.3 |
| Kingsburg: | 79.8 |
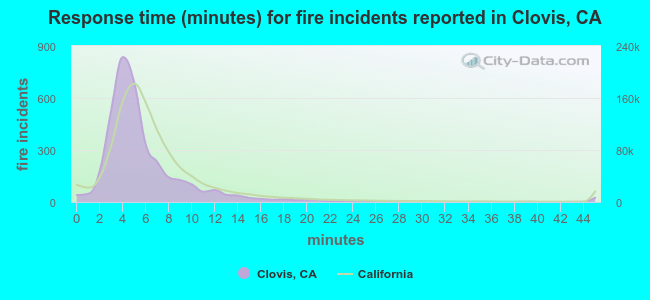 The median response time based on all reported fire incidents is 5 minutes. This is lower than the California median value.
The median response time in Clovis, CA compared to nearest cities:
(Note: Based on data for all years, including only cities with at least 500 fire incidents)
| Clovis: | 5 minutes |
| Fresno: | 5 minutes |
| Sanger: | 8 minutes |
| Easton: | 7 minutes |
| Parlier: | 11 minutes |
| Selma: | 6 minutes |
| Reedley: | 13 minutes |
| Caruthers: | 10 minutes |
| Kerman: | 9 minutes |
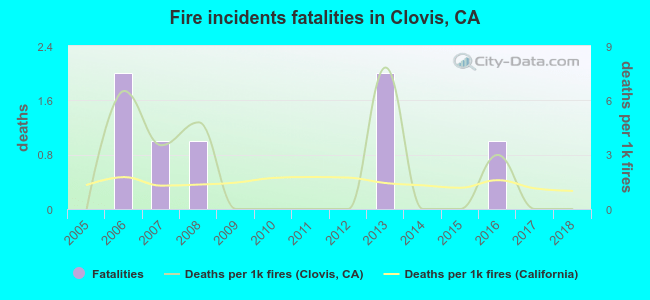 Based on the reports from the years 2005 - 2018 the average number of fire-related fatalities per year is 1. The highest number of deaths - 2 took place in 2006, and the lowest - 0 in 2005. The data has a constant trend.
The average number of fatalities per 1,000 fire incidents is 2. This indicator was the highest - 8 in 2013, and the lowest 0 in 2005. The trend for deaths per 1,000 fire incidents is constant. Compared to the California value the number of deaths per 1,000 fire incidents is higher.
Based on the reports from the years 2005 - 2018 the average number of fire-related fatalities per year is 1. The highest number of deaths - 2 took place in 2006, and the lowest - 0 in 2005. The data has a constant trend.
The average number of fatalities per 1,000 fire incidents is 2. This indicator was the highest - 8 in 2013, and the lowest 0 in 2005. The trend for deaths per 1,000 fire incidents is constant. Compared to the California value the number of deaths per 1,000 fire incidents is higher.
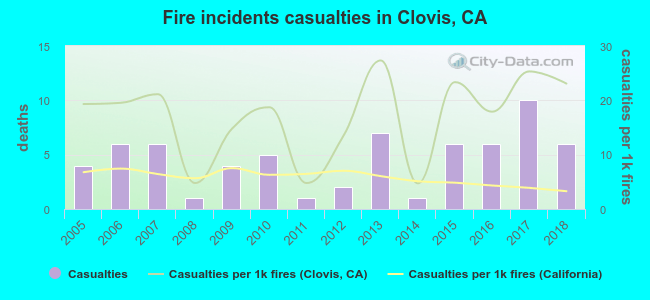 According to the reports from the years 2005 - 2018 the average number of fire-related casualties per year is 5. The highest number of reported injuries - 10 took place in 2017, and the lowest - 1 in 2008. The data has a growing trend.
The average number of injuries per 1,000 fire incidents is 17. This indicator was the highest - 27 in 2013, and the lowest 5 in 2014. The trend for injuries per 1,000 fire incidents is rising. Compared to the state value the number of casualties per 1,000 fires is much higher.
According to the reports from the years 2005 - 2018 the average number of fire-related casualties per year is 5. The highest number of reported injuries - 10 took place in 2017, and the lowest - 1 in 2008. The data has a growing trend.
The average number of injuries per 1,000 fire incidents is 17. This indicator was the highest - 27 in 2013, and the lowest 5 in 2014. The trend for injuries per 1,000 fire incidents is rising. Compared to the state value the number of casualties per 1,000 fires is much higher.
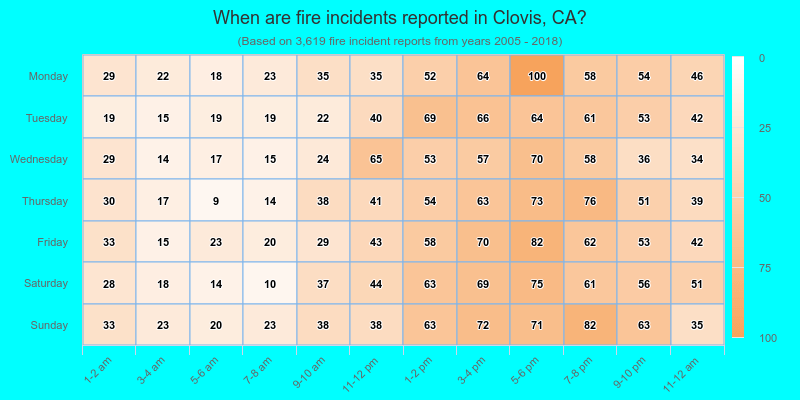
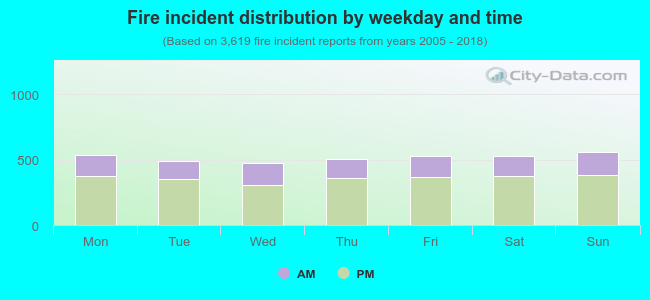 30.3% incidents where reported in the morning and 69.7% in the evening. The most fires (15.5%) took place on Sunday, and the least (13.0%) on Wednesday.
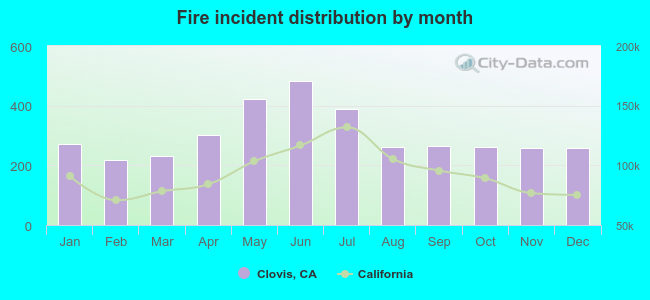 Based on the 3,619 fires from years 2005 - 2018 most fires (13.3%) took place during June, and the least (6.0%) in February.
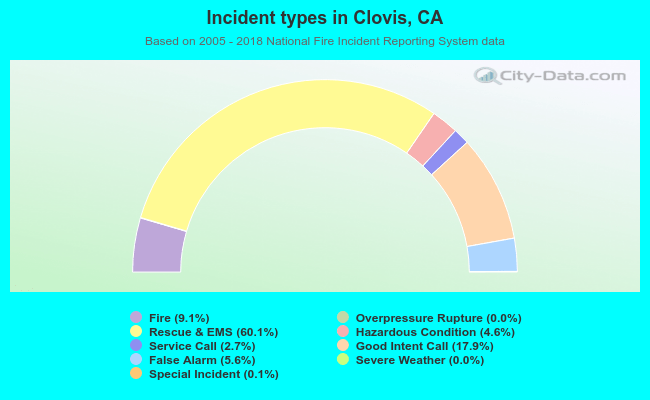 Out of all 39,748 cases reported during the years 2005 - 2018, the most belonged to the categories: Rescue & EMS (60.1%), Good Intent Call (17.9%), and Fire (9.1%).
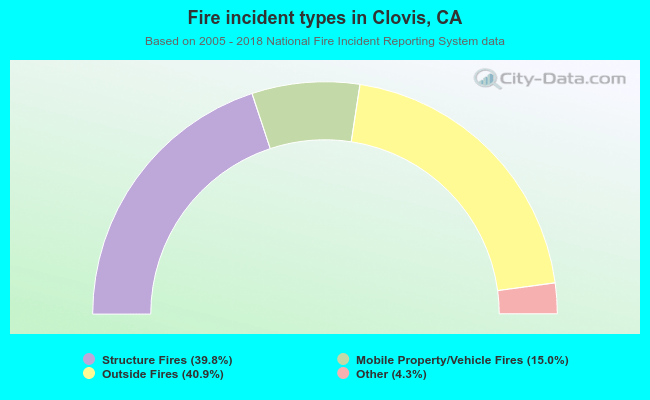 When looking into fire subcategories, the most incidents belonged to: Outside Fires (40.9%), and Structure Fires (39.8%).