Fresno: Fire Incidents, California (CA)
Where are fire incidents reported in Fresno, CA
Something went wrong! Please refresh the page.
| Fire incidents reported | |
|---|---|
| Sreet name | Count |
| BLACKSTONE AVE | 878 |
| FRESNO ST | 720 |
| BELMONT AVE | 682 |
| CEDAR AVE | 650 |
| SHAW AVE | 642 |
| SHIELDS AVE | 622 |
| OLIVE AVE | 554 |
| ASHLAN AVE | 510 |
| KINGS CANYON RD | 442 |
| CLINTON AVE | 424 |
| CHESTNUT AVE | 390 |
| TULARE ST | 388 |
| MCKINLEY AVE | 362 |
| GOLDEN STATE BLVD | 338 |
| JENSEN AVE | 328 |
| DAKOTA AVE | 320 |
| JENSEN | 316 |
| CEDAR | 312 |
| PEACH AVE | 302 |
| HERNDON AVE | 294 |
| MARKS AVE | 294 |
| CHURCH AVE | 292 |
| FRUIT AVE | 278 |
| G ST | 268 |
| MAPLE AVE | 252 |
| 1ST ST | 240 |
| CHESTNUT | 240 |
| VENTURA AVE | 240 |
| BELMONT | 204 |
| CORNELIA AVE | 204 |
| Other | 13,227 |
2004 - 2018 National Fire Incident Reporting System (NFIRS) incidents
- Incident types reported to NFIRS in Fresno, CA
- 91,69450.5%Rescue & EMS
- 41,03422.6%Good Intent Call
- 25,21313.9%Fire
- 10,1125.6%False Alarm
- 7,2664.0%Hazardous Condition
- 5,6583.1%Service Call
- 3810.2%Overpressure Rupture
- Fire incident types reported to NFIRS in Fresno, CA
- 12,42149.3%Outside Fires
- 7,72430.6%Structure Fires
- 4,30817.1%Mobile Property/Vehicle Fires
- 7603.0%Other
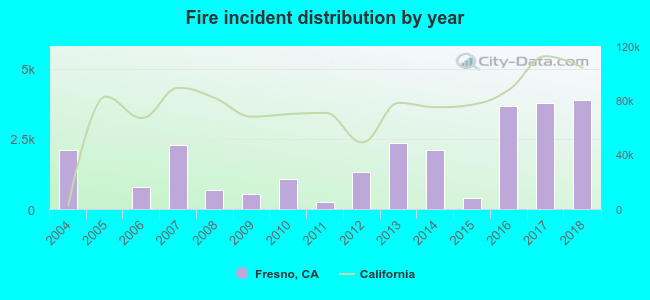 According to the data from the years 2004 - 2018 the average number of fires per year is 1,681. The highest number of fires - 3,877 took place in 2018, and the least - 8 in 2005. The data has a rising trend.
The average number of yearly fire incidents per 10k residents in Fresno, CA compared to nearest cities:
(Note: Based on data for the last 3 years, including only cities with population 5,000 and above)
| Fresno: | 73.2 |
| Clovis: | 32.3 |
| Fowler: | 80.0 |
| Sanger: | 67.4 |
| Kerman: | 52.3 |
| Selma: | 122.0 |
| Parlier: | 45.4 |
| Madera: | 19.3 |
| Madera Acres: | 1.8 |
 The median response time based on all reported fire incidents is 5 minutes. This is lower compared to the state median value.
The median response time in Fresno, CA compared to nearest cities:
(Note: Based on data for all years, including only cities with at least 500 fire incidents)
| Fresno: | 5 minutes |
| Clovis: | 5 minutes |
| Easton: | 7 minutes |
| Sanger: | 8 minutes |
| Kerman: | 9 minutes |
| Caruthers: | 10 minutes |
| Selma: | 6 minutes |
| Parlier: | 11 minutes |
| Madera: | 10 minutes |
 According to the data from the years 2004 - 2018 the average number of fire-related yearly deaths is 2. The highest number of deaths - 8 took place in 2004, and the lowest - 0 in 2005. The data has a decreasing trend.
The average number of deaths per 1,000 fires is 1. This indicator was the highest - 4 in 2004, and the lowest 0 in 2005. The trend for fatalities per 1,000 fires is dropping. Compared to the California value the number of fatalities per 1,000 fires is lower.
According to the data from the years 2004 - 2018 the average number of fire-related yearly deaths is 2. The highest number of deaths - 8 took place in 2004, and the lowest - 0 in 2005. The data has a decreasing trend.
The average number of deaths per 1,000 fires is 1. This indicator was the highest - 4 in 2004, and the lowest 0 in 2005. The trend for fatalities per 1,000 fires is dropping. Compared to the California value the number of fatalities per 1,000 fires is lower.
 Based on the reports from the years 2004 - 2018 the average number of fire-related casualties per year is 17. The highest number of injuries - 57 took place in 2004, and the lowest - 0 in 2005. The data has a declining trend.
The average number of casualties per 1,000 fires is 8. This indicator was the highest - 27 in 2004, and the lowest 0 in 2005. The trend for casualties per 1,000 fire incidents is declining. Compared to the state value the number of injuries per 1,000 fires is higher.
Based on the reports from the years 2004 - 2018 the average number of fire-related casualties per year is 17. The highest number of injuries - 57 took place in 2004, and the lowest - 0 in 2005. The data has a declining trend.
The average number of casualties per 1,000 fires is 8. This indicator was the highest - 27 in 2004, and the lowest 0 in 2005. The trend for casualties per 1,000 fire incidents is declining. Compared to the state value the number of injuries per 1,000 fires is higher.
 37.0% incidents where reported in the morning and 63.0% in the evening. The most fires (15.1%) took place on Tuesday, and the least (13.5%) on Friday.
 According to the 25,213 fires from years 2004 - 2018 most fires (13.0%) took place during July, and the least (5.4%) in December.
 Out of all 181,516 cases reported during the years 2004 - 2018, the most belonged to the categories: Rescue & EMS (50.5%), Good Intent Call (22.6%), and Fire (13.9%).
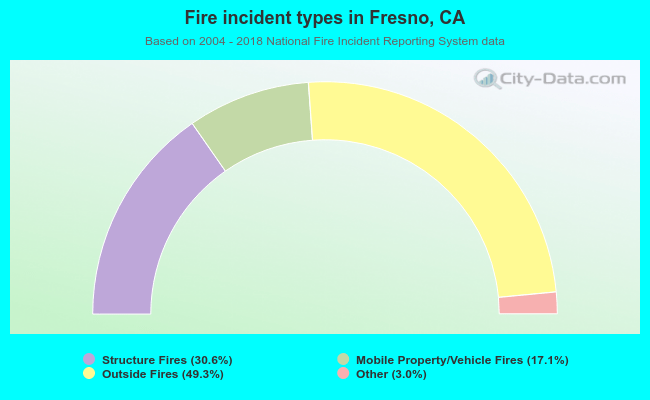 When looking into fire subcategories, the most incidents belonged to: Outside Fires (49.3%), and Structure Fires (30.6%).