Cohasset: Fire Incidents, Massachusetts (MA)
Where are fire incidents reported in Cohasset, MA
Something went wrong! Please refresh the page.
| Fire incidents reported | |
|---|---|
| Sreet name | Count |
| JERUSALEM RD | 118 |
| SOUTH MAIN ST | 116 |
| ELM ST | 98 |
| CHIEF JUSTICE CUSHING HWY | 94 |
| CHIEF JUSTICE CUSHING WAY | 78 |
| KING ST | 68 |
| NORTH MAIN ST | 54 |
| BEECHWOOD ST | 46 |
| MUTUAL AID TO COHASSET | 36 |
| BORDER ST | 32 |
| NICHOLS RD | 30 |
| POND ST | 30 |
| ATLANTIC AVE | 28 |
| CEDAR ST | 28 |
| HULL ST | 28 |
| DOANE ST | 24 |
| HIGHLAND AVE | 22 |
| SOHIER ST | 22 |
| AVALON DR | 20 |
| SUMMER ST | 20 |
| FOREST AVE | 18 |
| BLACK HORSE LN | 16 |
| HOWARD GLEASON RD | 16 |
| SURRY DR | 16 |
| LINDEN DR | 14 |
| BLACK ROCK RD | 12 |
| JERUSALEM ROAD DR | 12 |
| PLEASANT ST | 12 |
| WHEELWRIGHT | 12 |
| AARON RIVER RD | 10 |
2002 - 2018 National Fire Incident Reporting System (NFIRS) incidents
- Incident types reported to NFIRS in Cohasset, MA
- 3,67038.0%Rescue & EMS
- 2,31123.9%Hazardous Condition
- 1,23112.7%Service Call
- 1,06511.0%False Alarm
- 8378.7%Fire
- 4124.3%Good Intent Call
- 770.8%Severe Weather
- 550.6%Special Incident
- Fire incident types reported to NFIRS in Cohasset, MA
- 49058.5%Structure Fires
- 22627.0%Outside Fires
- 9010.8%Other
- 313.7%Mobile Property/Vehicle Fires
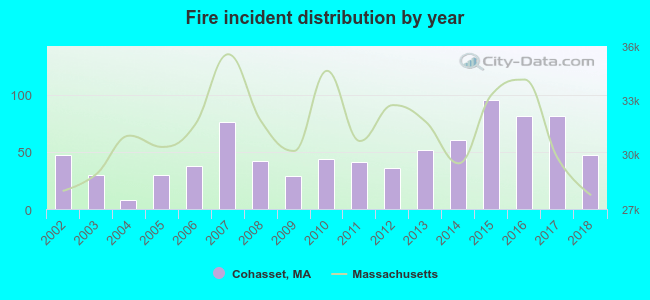 According to the data from the years 2002 - 2018 the average number of fires per year is 49. The highest number of reported fires - 95 took place in 2015, and the least - 8 in 2004. The data has a constant trend.
The average number of yearly fire incidents per 10k residents in Cohasset, MA compared to nearest cities:
(Note: Based on data for the last 3 years, including only cities with population 5,000 and above)
| Cohasset: | 92.4 |
| Hingham: | 140.4 |
| Hull: | 24.6 |
| Scituate: | 125.2 |
| Norwell: | 40.0 |
| Weymouth: | 50.1 |
| Hanover: | 38.7 |
| Rockland: | 46.9 |
| Braintree: | 24.7 |
 The median response time based on all reported fire incidents is 6 minutes. This is higher compared to the Massachusetts median value.
The median response time in Cohasset, MA compared to nearest cities:
(Note: Based on data for all years, including only cities with at least 500 fire incidents)
| Cohasset: | 6 minutes |
| Hingham: | 5 minutes |
| Hull: | 3 minutes |
| Scituate: | 4 minutes |
| Norwell: | 5 minutes |
| Weymouth: | 4 minutes |
| Hanover: | 5 minutes |
| Rockland: | 3 minutes |
| Braintree: | 3 minutes |
 28.1% incidents where reported in the morning and 71.9% in the evening. The most fires (16.2%) took place on Wednesday, and the least (12.4%) on Thursday.
 Based on the 837 reports from years 2002 - 2018 most fires (10.9%) took place during April, and the least (6.3%) in February.
 Out of all 9,663 cases reported during the years 2002 - 2018, the most belonged to the categories: Rescue & EMS (38.0%), Hazardous Condition (23.9%), and Service Call (12.7%).
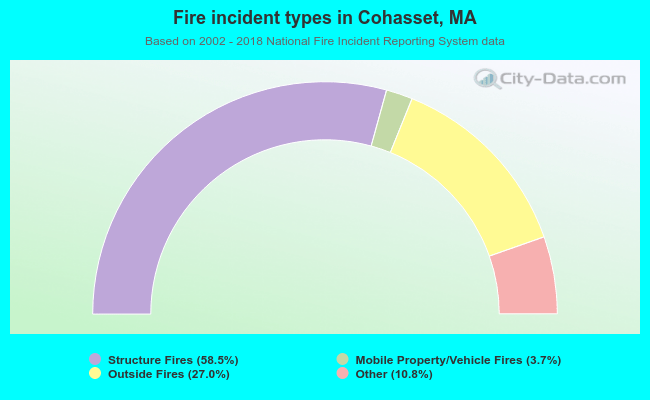 When looking into fire subcategories, the most reports belonged to: Structure Fires (58.5%), and Outside Fires (27.0%).