Coxs Creek: Fire Incidents, Kentucky (KY)
Where are fire incidents reported in Coxs Creek, KY
Something went wrong! Please refresh the page.
|
| |||||||||||||||||||||||||||||||||||||||||||||||||||||||||||||||||||||||||||||||||||||||||||||||||||||||||||||
2002 - 2018 National Fire Incident Reporting System (NFIRS) incidents
- Incident types reported to NFIRS in Coxs Creek, KY
- 10354.8%Fire
- 2613.8%Hazardous Condition
- 2513.3%Good Intent Call
- 2211.7%Rescue & EMS
- 73.7%False Alarm
- 42.1%Service Call
- 10.5%Special Incident
- Fire incident types reported to NFIRS in Coxs Creek, KY
- 4341.7%Structure Fires
- 3029.1%Outside Fires
- 2726.2%Mobile Property/Vehicle Fires
- 32.9%Other
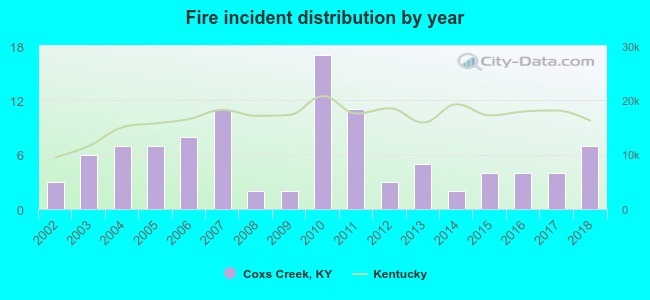 Based on the data from the years 2002 - 2018 the average number of fires per year is 6. The highest number of reported fires - 17 took place in 2010, and the least - 2 in 2008. The data has an increasing trend.
The average number of yearly fire incidents per 10k residents in Coxs Creek, KY compared to nearest cities:
(Note: Based on data for the last 3 years, including only cities with population 5,000 and above)
| Coxs Creek: | 7.1 |
| Bardstown: | 41.5 |
| Shepherdsville: | 177.7 |
| Hillview: | 7.5 |
| Fern Creek: | 25.6 |
| Okolona: | 0.5 |
| Fairdale: | 29.7 |
| Jeffersontown: | 23.4 |
| Shelbyville: | 82.3 |
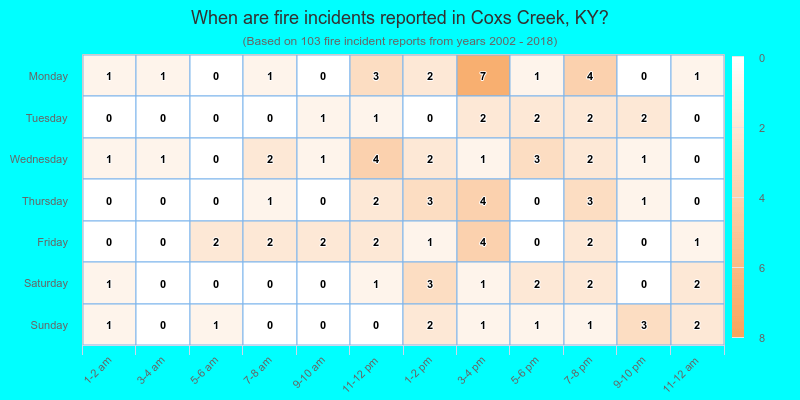
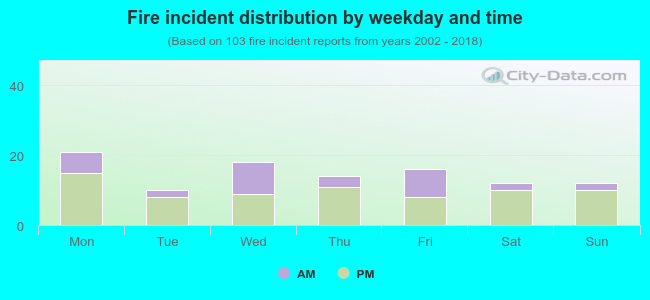 31.1% incidents where reported in the morning and 68.9% in the evening. The most fires (20.4%) took place on Monday, and the least (9.7%) on Tuesday.
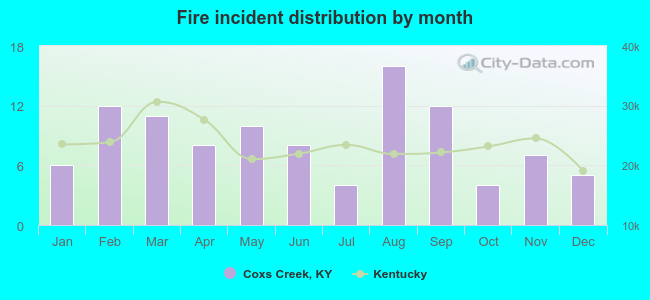 According to the 103 incident reports from years 2002 - 2018 most fires (15.5%) took place during August, and the least (3.9%) in July.
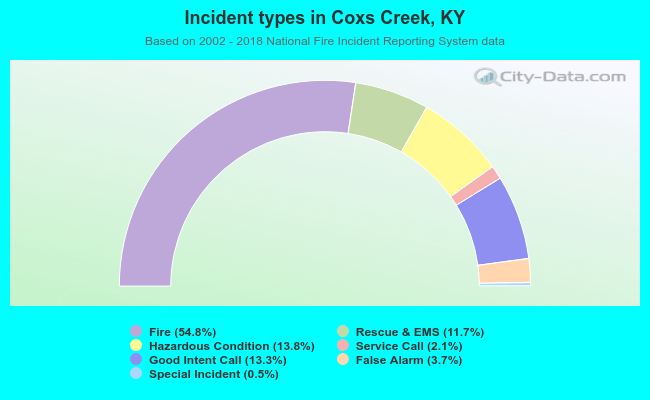 Out of all 188 cases reported during the years 2002 - 2018, the most belonged to the categories: Fire (54.8%), Rescue & EMS (13.8%), and Service Call (13.3%).
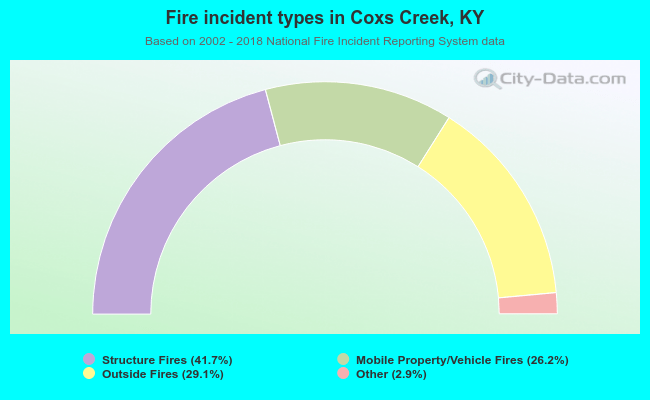 When looking into fire subcategories, the most incidents belonged to: Structure Fires (41.7%), and Outside Fires (29.1%).