Fairdale: Fire Incidents, Kentucky (KY)
Where are fire incidents reported in Fairdale, KY
Something went wrong! Please refresh the page.
|
| |||||||||||||||||||||||||||||||||||||||||||||||||||||||||||||||||||||||||||||||||||||||||||||||||||||||||||||
2002 - 2018 National Fire Incident Reporting System (NFIRS) incidents
- Incident types reported to NFIRS in Fairdale, KY
- 1,15733.4%Hazardous Condition
- 82623.9%Fire
- 76022.0%Rescue & EMS
- 2707.8%Good Intent Call
- 2567.4%Service Call
- 1775.1%False Alarm
- 100.3%Overpressure Rupture
- Fire incident types reported to NFIRS in Fairdale, KY
- 36944.7%Outside Fires
- 21225.7%Mobile Property/Vehicle Fires
- 20424.7%Structure Fires
- 415.0%Other
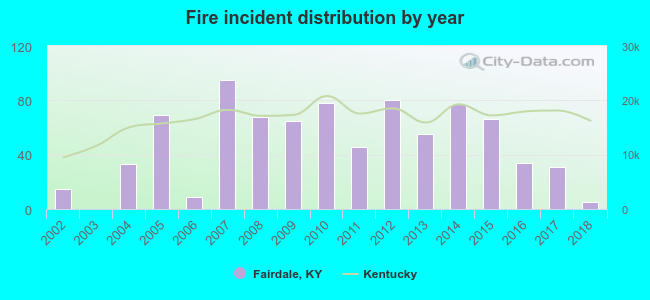 According to the data from the years 2002 - 2018 the average number of fire incidents per year is 49. The highest number of reported fires - 95 took place in 2007, and the least - 0 in 2003. The data has a dropping trend.
The average number of yearly fire incidents per 10k residents in Fairdale, KY compared to nearest cities:
(Note: Based on data for the last 3 years, including only cities with population 5,000 and above)
| Fairdale: | 29.7 |
| Okolona: | 0.5 |
| Hillview: | 7.5 |
| Shively: | 11.2 |
| Louisville: | 99.8 |
| Shepherdsville: | 177.7 |
| Fern Creek: | 25.6 |
| Jeffersontown: | 23.4 |
| Lyndon: | 0.9 |
 The median response time based on all reported fire incidents is 5 minutes. This is lower compared to the state median value.
The median response time in Fairdale, KY compared to nearest cities:
(Note: Based on data for all years, including only cities with at least 500 fire incidents)
| Fairdale: | 5 minutes |
| Louisville: | 4 minutes |
| Shepherdsville: | 6 minutes |
| Fern Creek: | 5 minutes |
| Jeffersontown: | 5 minutes |
| Jeffersonville: | 4 minutes |
| New Albany: | 4 minutes |
| Clarksville: | 4 minutes |
 25.8% incidents where reported in the morning and 74.2% in the evening. The most fires (16.3%) took place on Monday, and the least (11.7%) on Friday.
 According to the 826 incident reports from years 2002 - 2018 most fires (11.0%) took place during August, and the least (5.3%) in December.
 Out of all 3,461 cases reported during the years 2002 - 2018, the most belonged to the categories: Hazardous Condition (33.4%), Fire (23.9%), and Rescue & EMS (22.0%).
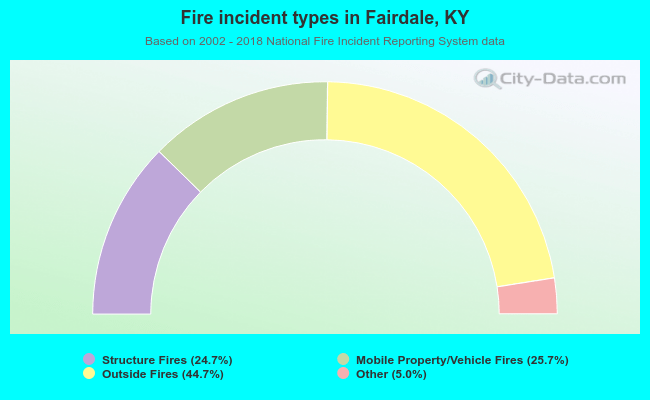 When looking into fire subcategories, the most incidents belonged to: Outside Fires (44.7%), and Mobile Property/Vehicle Fires (25.7%).