Crawfordsville: Fire Incidents, Indiana (IN)
Where are fire incidents reported in Crawfordsville, IN
Something went wrong! Please refresh the page.
| Fire incidents reported | |
|---|---|
| Sreet name | Count |
| WABASH AVE | 76 |
| 32 HWY | 68 |
| PIKE ST | 66 |
| WASHINGTON ST | 64 |
| 300 RD | 54 |
| MARKET ST | 50 |
| 231 | 48 |
| 136 HWY | 46 |
| DARLINGTON AVE | 40 |
| JEFFERSON ST | 38 |
| 400 RD | 36 |
| COLLEGE ST | 36 |
| MAIN ST | 34 |
| 47 HWY | 32 |
| LAFAYETTE RD | 32 |
| TRACTION RD | 32 |
| LAFAYETTE AVE | 30 |
| 150 | 28 |
| TUTTLE AVE | 26 |
| CHESTNUT ST | 24 |
| COUNTRY CLUB RD | 24 |
| ENGLEWOOD DR | 24 |
| GRANT AVE | 24 |
| JENNISON ST | 24 |
| NUCOR RD | 24 |
| 200 | 20 |
| ELMORE ST | 20 |
| I-74 | 20 |
| OAK ST | 20 |
| 231 RD | 18 |
| Other | 586 |
2002 - 2017 National Fire Incident Reporting System (NFIRS) incidents
- Incident types reported to NFIRS in Crawfordsville, IN
- 1,66443.3%Fire
- 1,00826.3%Rescue & EMS
- 80220.9%Hazardous Condition
- 1373.6%Service Call
- 1223.2%False Alarm
- 792.1%Good Intent Call
- 140.4%Overpressure Rupture
- 80.2%Special Incident
- 60.2%Severe Weather
- Fire incident types reported to NFIRS in Crawfordsville, IN
- 77046.3%Outside Fires
- 50730.5%Structure Fires
- 23914.4%Mobile Property/Vehicle Fires
- 1488.9%Other
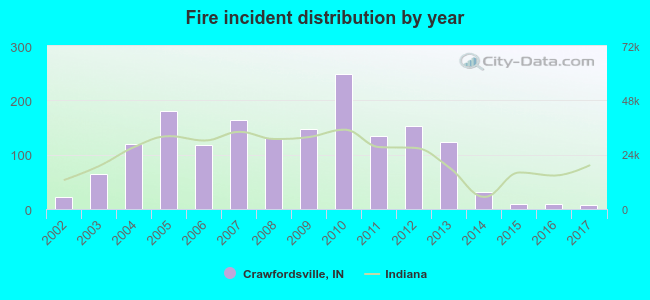 Based on the data from the years 2002 - 2017 the average number of fires per year is 104. The highest number of fire incidents - 249 took place in 2010, and the least - 7 in 2017. The data has a decreasing trend.
The average number of yearly fire incidents per 10k residents in Crawfordsville, IN compared to nearest cities:
(Note: Based on data for the last 3 years, including only cities with population 5,000 and above)
| Crawfordsville: | 5.3 |
| Lebanon: | 10.9 |
| Lafayette: | 13.1 |
| Frankfort: | 19.8 |
| Greencastle: | 44.4 |
| Danville: | 44.1 |
| West Lafayette: | 30.1 |
| Whitestown: | 40.6 |
| Brownsburg: | 19.2 |
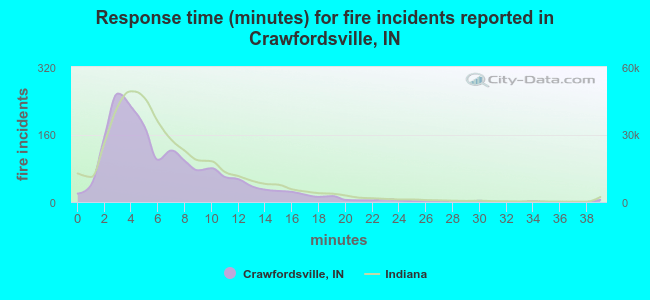 The median response time based on all reported fire incidents is 5 minutes. This is lower than the state median value.
The median response time in Crawfordsville, IN compared to nearest cities:
(Note: Based on data for all years, including only cities with at least 500 fire incidents)
| Crawfordsville: | 5 minutes |
| Lebanon: | 5 minutes |
| Attica: | 10 minutes |
| Lafayette: | 4 minutes |
| Rockville: | 8 minutes |
| Frankfort: | 6 minutes |
| Greencastle: | 9 minutes |
| Danville: | 8 minutes |
| West Lafayette: | 4 minutes |
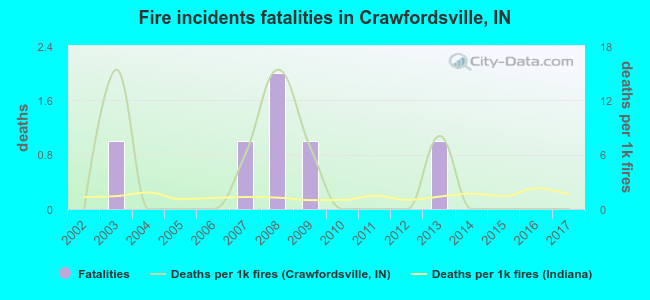 According to the data from the years 2002 - 2017 the average number of fire-related fatalities per year is 0. The highest number of deaths - 2 took place in 2008, and the lowest - 0 in 2002. The data has a constant trend.
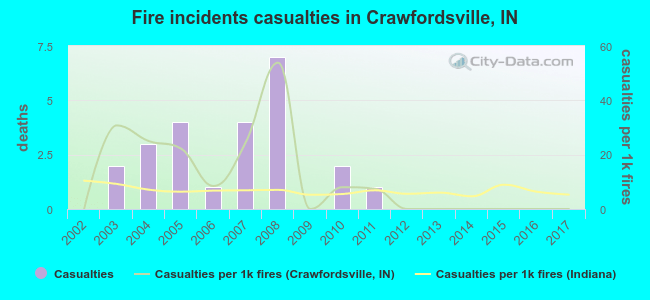 Based on the data from the years 2002 - 2017 the average number of fire-related casualties per year is 2. The highest number of reported casualties - 7 took place in 2008, and the lowest - 0 in 2002. The data has a constant trend.
The average number of injuries per 1,000 fires is 11. This indicator was the highest - 54 in 2008, and the lowest 0 in 2002. The trend for injuries per 1,000 fire incidents is constant. Compared to the Indiana value the number of casualties per 1,000 fire incidents is much higher.
Based on the data from the years 2002 - 2017 the average number of fire-related casualties per year is 2. The highest number of reported casualties - 7 took place in 2008, and the lowest - 0 in 2002. The data has a constant trend.
The average number of injuries per 1,000 fires is 11. This indicator was the highest - 54 in 2008, and the lowest 0 in 2002. The trend for injuries per 1,000 fire incidents is constant. Compared to the Indiana value the number of casualties per 1,000 fire incidents is much higher.Casualties per 1,000 incidents in Crawfordsville, IN compared to nearest cities:
(Note: Based on data for all years, including only cities with at least 500 fire incidents)
| Crawfordsville: | 14.4 |
| Lebanon: | 16.4 |
| Attica: | 0.0 |
| Lafayette: | 4.2 |
| Rockville: | 1.4 |
| Frankfort: | 1.7 |
| Greencastle: | 5.2 |
| Danville: | 0.9 |
| West Lafayette: | 1.9 |
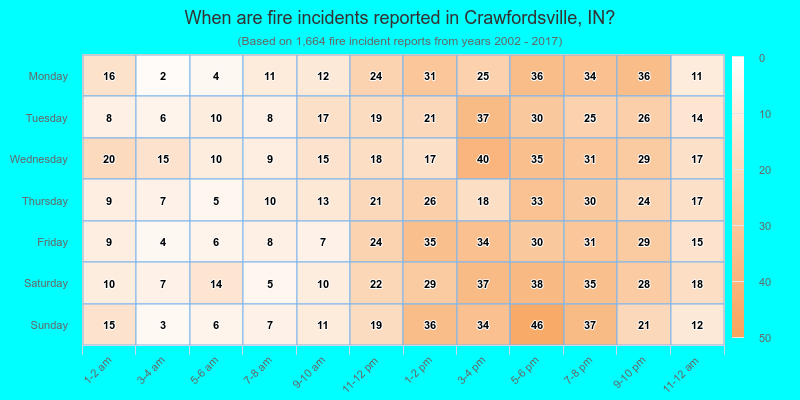
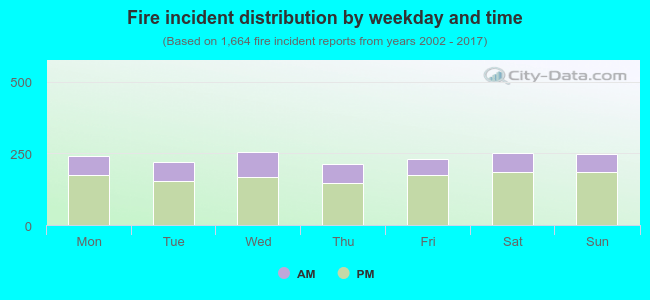 28.6% incidents where reported in the morning and 71.4% in the evening. The most fires (15.4%) took place on Wednesday, and the least (12.8%) on Thursday.
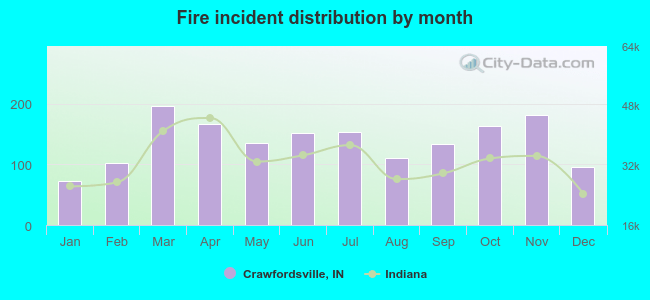 According to the 1,664 fire incidents from years 2002 - 2017 most fires (11.8%) took place during March, and the least (4.4%) in January.
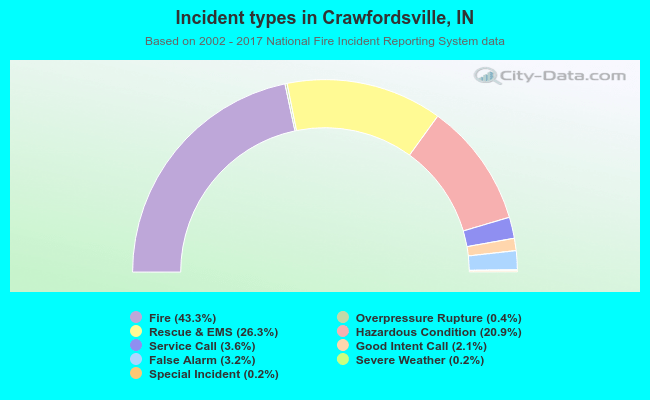 Out of all 3,840 cases reported during the years 2002 - 2017, the most belonged to the categories: Fire (43.3%), Rescue & EMS (26.3%), and Hazardous Condition (20.9%).
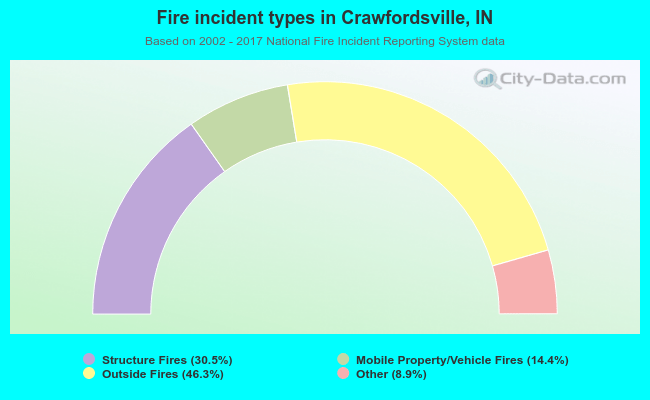 When looking into fire subcategories, the most incidents belonged to: Outside Fires (46.3%), and Structure Fires (30.5%).