Damascus: Fire Incidents, Oregon (OR)
Where are fire incidents reported in Damascus, OR
Something went wrong! Please refresh the page.
|
| |||||||||||||||||||||||||||||||||||||||||||||||||||||||||||||||||||||||||||||||||||||||||||||||||||||||||||||
2006 - 2018 National Fire Incident Reporting System (NFIRS) incidents
- Incident types reported to NFIRS in Damascus, OR
- 1,31638.0%Rescue & EMS
- 83124.0%Hazardous Condition
- 52715.2%Service Call
- 36310.5%Fire
- 3389.8%Good Intent Call
- 812.3%False Alarm
- Fire incident types reported to NFIRS in Damascus, OR
- 14840.8%Structure Fires
- 14239.1%Outside Fires
- 6417.6%Mobile Property/Vehicle Fires
- 92.5%Other
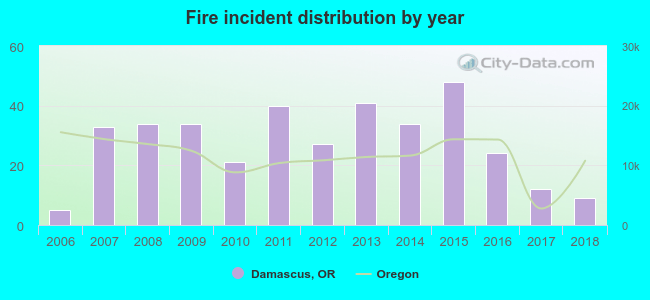 Based on the data from the years 2006 - 2018 the average number of fire incidents per year is 28. The highest number of fires - 48 took place in 2015, and the least - 5 in 2006. The data has an increasing trend.
The average number of yearly fire incidents per 10k residents in Damascus, OR compared to nearest cities:
(Note: Based on data for the last 3 years, including only cities with population 5,000 and above)
| Damascus: | 13.8 |
| Happy Valley: | 20.6 |
| Clackamas: | 79.2 |
| Gresham: | 13.1 |
| Gladstone: | 27.8 |
| Milwaukie: | 31.5 |
| Oregon City: | 20.3 |
| Troutdale: | 9.9 |
| Fairview: | 14.1 |
 Based on the reports from the years 2006 - 2018 the average number of fire-related yearly casualties is 1. The highest number of injuries - 5 took place in 2011, and the lowest - 0 in 2006. The data has a constant trend.
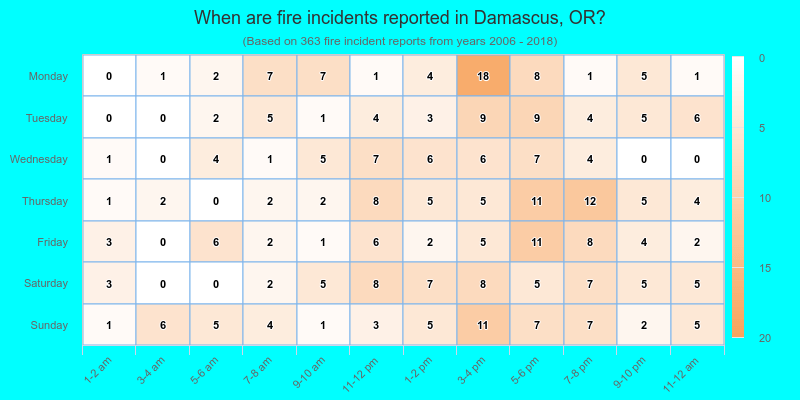
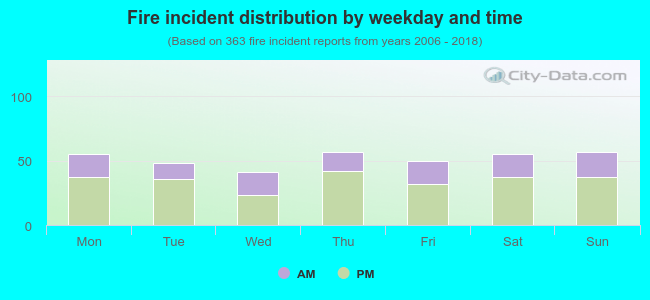 32.8% incidents where reported in the morning and 67.2% in the evening. The most fires (15.7%) took place on Thursday, and the least (11.3%) on Wednesday.
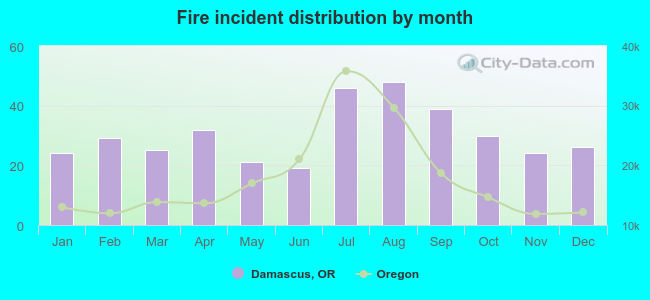 Based on the 363 fire incident reports from years 2006 - 2018 most fires (13.2%) took place during August, and the least (5.2%) in June.
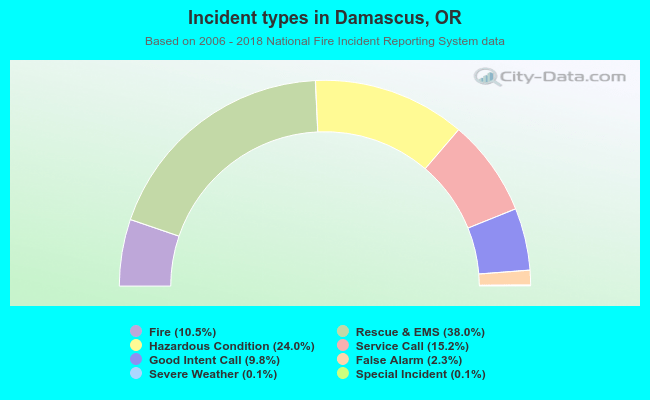 Out of all 3,460 cases reported during the years 2006 - 2018, the most belonged to the categories: Overpressure Rupture (38.0%), Rescue & EMS (24.0%), and Hazardous Condition (15.2%).
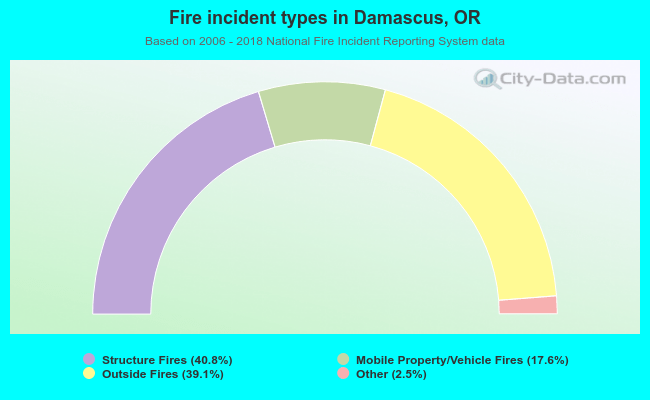 When looking into fire subcategories, the most incidents belonged to: Structure Fires (40.8%), and Outside Fires (39.1%).