Dartmouth: Fire Incidents, Massachusetts (MA)
Where are fire incidents reported in Dartmouth, MA
Something went wrong! Please refresh the page.
| Fire incidents reported | |
|---|---|
| Sreet name | Count |
| STATE RD | 542 |
| FAUNCE CORNER RD | 376 |
| OLD WESTPORT RD | 218 |
| DARTMOUTH MALL | 68 |
| OLD FALL RIVER RD | 66 |
| DARTMOUTH ST | 54 |
| 285 OLD WESTPORT ROAD RD | 46 |
| REED RD | 46 |
| HIXVILLE RD | 42 |
| SLOCUM RD | 42 |
| I195 EASTBOUND | 36 |
| CROSS RD | 34 |
| CROSSROADS DR | 34 |
| RUSSELLS MILLS RD | 28 |
| FAUNCE CORNER ROAD | 26 |
| HIGHLAND AVE | 26 |
| ALLEN ST | 24 |
| I195 WESTBOUND | 24 |
| HIGH HILL RD | 22 |
| TUCKER RD | 20 |
| CHASE RD | 18 |
| FLAG SWAMP RD | 16 |
| HAWTHORN ST | 14 |
| POTOMSKA RD | 14 |
| STATE ROAD | 14 |
| BAKERVILLE RD | 12 |
| FISHER RD | 12 |
| I-195 EASTBOUND | 12 |
| LEDGEWOOD BLVD | 12 |
| SMITH NECK RD | 12 |
2005 - 2018 National Fire Incident Reporting System (NFIRS) incidents
- Incident types reported to NFIRS in Dartmouth, MA
- 1,95026.4%Hazardous Condition
- 1,52420.6%Fire
- 1,28017.3%False Alarm
- 1,10214.9%Service Call
- 88712.0%Rescue & EMS
- 5567.5%Good Intent Call
- 680.9%Severe Weather
- 170.2%Overpressure Rupture
- 120.2%Special Incident
- Fire incident types reported to NFIRS in Dartmouth, MA
- 78951.8%Outside Fires
- 39926.2%Structure Fires
- 22014.4%Mobile Property/Vehicle Fires
- 1167.6%Other
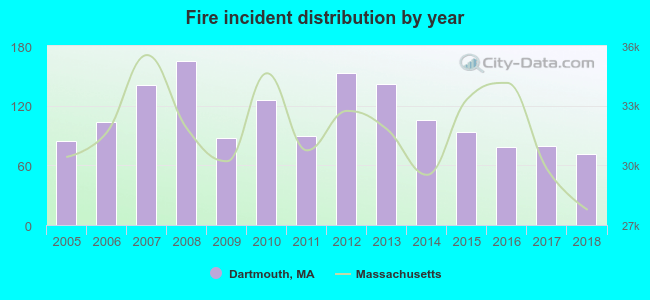 Based on the data from the years 2005 - 2018 the average number of fires per year is 109. The highest number of reported fires - 165 took place in 2008, and the least - 71 in 2018. The data has a declining trend.
The average number of yearly fire incidents per 10k residents in Dartmouth, MA compared to nearest cities:
(Note: Based on data for the last 3 years, including only cities with population 5,000 and above)
| Dartmouth: | 22.3 |
| New Bedford: | 46.5 |
| Fairhaven: | 30.2 |
| Westport: | 41.0 |
| Acushnet: | 21.7 |
| Mattapoisett: | 32.5 |
| Fall River: | 48.8 |
| Freetown: | 4.5 |
| Rochester: | 13.4 |
 The median response time based on all reported fire incidents is 6 minutes. This is higher compared to the Massachusetts median value.
The median response time in Dartmouth, MA compared to nearest cities:
(Note: Based on data for all years, including only cities with at least 500 fire incidents)
| Dartmouth: | 6 minutes |
| New Bedford: | 4 minutes |
| Fairhaven: | 3 minutes |
| Westport: | 5 minutes |
| Fall River: | 5 minutes |
| Somerset: | 6 minutes |
| Lakeville: | 6 minutes |
| Swansea: | 7 minutes |
| Wareham: | 6 minutes |
 Based on the reports from the years 2005 - 2018 the average number of fire-related casualties per year is 1. The highest number of reported casualties - 2 took place in 2015, and the lowest - 0 in 2005. The data has a rising trend.
The average number of casualties per 1,000 fire incidents is 7. This indicator was the highest - 28 in 2018, and the lowest 0 in 2005. The trend for injuries per 1,000 fires is increasing. Compared to the Massachusetts value the number of casualties per 1,000 incidents is lower.
Based on the reports from the years 2005 - 2018 the average number of fire-related casualties per year is 1. The highest number of reported casualties - 2 took place in 2015, and the lowest - 0 in 2005. The data has a rising trend.
The average number of casualties per 1,000 fire incidents is 7. This indicator was the highest - 28 in 2018, and the lowest 0 in 2005. The trend for injuries per 1,000 fires is increasing. Compared to the Massachusetts value the number of casualties per 1,000 incidents is lower.Casualties per 1,000 incidents in Dartmouth, MA compared to nearest cities:
(Note: Based on data for all years, including only cities with at least 500 fire incidents)
| Dartmouth: | 5.9 |
| New Bedford: | 21.2 |
| Fairhaven: | 25.7 |
| Westport: | 15.5 |
| Fall River: | 26.2 |
| Somerset: | 17.1 |
| Lakeville: | 0.0 |
| Swansea: | 9.5 |
| Wareham: | 25.5 |
 29.3% incidents where reported in the morning and 70.7% in the evening. The most fires (16.7%) took place on Sunday, and the least (13.4%) on Friday.
 According to the 1,524 fire incident reports from years 2005 - 2018 most fires (12.9%) took place during May, and the least (4.8%) in October.
 Out of all 7,396 cases reported during the years 2005 - 2018, the most belonged to the categories: Hazardous Condition (26.4%), Fire (20.6%), and False Alarm (17.3%).
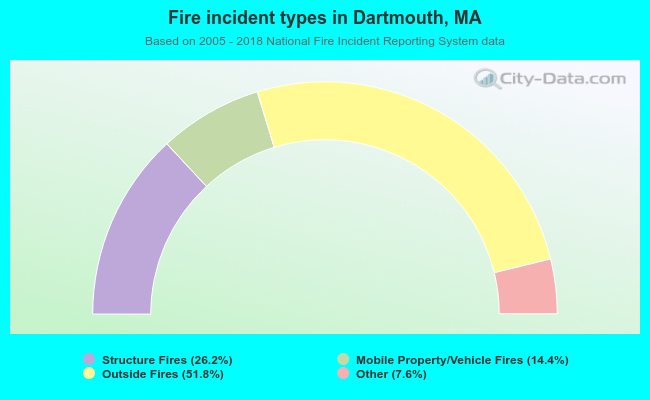 When looking into fire subcategories, the most incidents belonged to: Outside Fires (51.8%), and Structure Fires (26.2%).