Drummonds: Fire Incidents, Tennessee (TN)
Where are fire incidents reported in Drummonds, TN
Something went wrong! Please refresh the page.
|
| |||||||||||||||||||||||||||||||||||||||||||||||||||||||||||||||||||||||||||||||||||||||||||||||||||||||||||||
2002 - 2018 National Fire Incident Reporting System (NFIRS) incidents
- Incident types reported to NFIRS in Drummonds, TN
- 46649.3%Rescue & EMS
- 32934.8%Fire
- 10110.7%Good Intent Call
- 212.2%Hazardous Condition
- 151.6%False Alarm
- 121.3%Service Call
- 10.1%Overpressure Rupture
- 10.1%Severe Weather
- Fire incident types reported to NFIRS in Drummonds, TN
- 20060.8%Structure Fires
- 10431.6%Outside Fires
- 154.6%Mobile Property/Vehicle Fires
- 103.0%Other
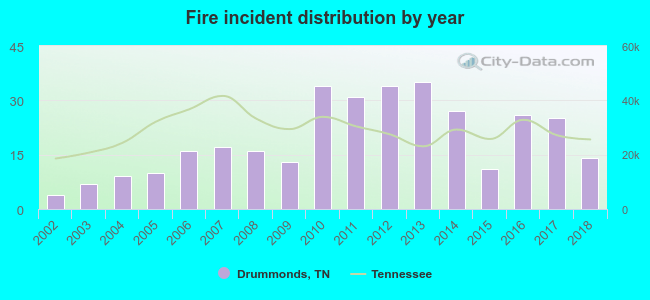 Based on the data from the years 2002 - 2018 the average number of fire incidents per year is 19. The highest number of fires - 35 took place in 2013, and the least - 4 in 2002. The data has a growing trend.
The average number of yearly fire incidents per 10k residents in Drummonds, TN compared to nearest cities:
(Note: Based on data for the last 3 years, including only cities with population 5,000 and above)
| Drummonds: | 38.0 |
| Munford: | 50.1 |
| Millington: | 173.9 |
| Atoka: | 78.0 |
| Bartlett: | 19.2 |
| Covington: | 142.4 |
| Lakeland: | 21.0 |
| Arlington: | 86.2 |
| Memphis: | 53.0 |

 30.7% incidents where reported in the morning and 69.3% in the evening. The most fires (17.6%) took place on Tuesday, and the least (10.9%) on Thursday.
 Based on the 329 fires from years 2002 - 2018 most fires (13.7%) took place during March, and the least (5.2%) in August.
 Out of all 946 cases reported during the years 2002 - 2018, the most belonged to the categories: Rescue & EMS (49.3%), Fire (34.8%), and Good Intent Call (10.7%).
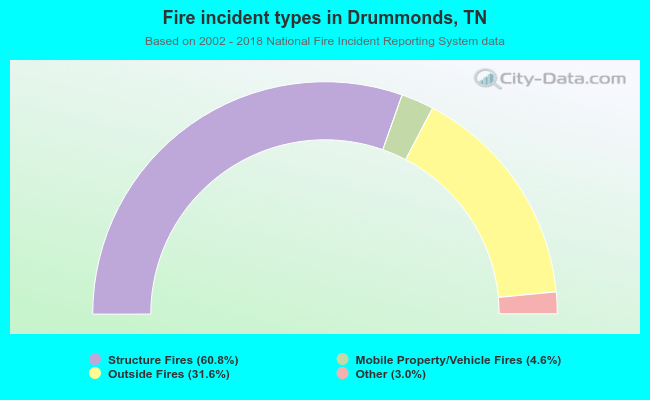 When looking into fire subcategories, the most reports belonged to: Structure Fires (60.8%), and Outside Fires (31.6%).