Edgewater: Fire Incidents, Florida (FL)
Where are fire incidents reported in Edgewater, FL
Something went wrong! Please refresh the page.
| Fire incidents reported | |
|---|---|
| Sreet name | Count |
| RIDGEWOOD AVE | 236 |
| INDIAN RIVER BLVD | 98 |
| INDIA PALM DR | 94 |
| VICTORY PALM DR | 66 |
| I95 | 54 |
| YULE TREE DR | 52 |
| O POSSUM CAMP RD | 48 |
| QUEEN PALM DR | 48 |
| MANGO TREE DR | 46 |
| WILLOW OAK DR | 46 |
| HIBISCUS DR | 44 |
| I-95 | 44 |
| PARK AVE | 44 |
| PINE TREE DR | 44 |
| SABAL PALM DR | 44 |
| KUMQUAT DR | 40 |
| VOLCO RD | 40 |
| ROYAL PALM DR | 38 |
| ORANGE TREE DR | 36 |
| VISTA PALM DR | 36 |
| ROBERTS RD | 34 |
| TRAVELERS PALM DR | 34 |
| FERN PALM DR | 32 |
| AIR PARK RD | 30 |
| GUAVA DR | 30 |
| JUNIPER DR | 30 |
| UMBRELLA TREE DR | 30 |
| RIDGEWOOD | 28 |
| RIVERSIDE DR | 28 |
| US HWY 1 | 28 |
2003 - 2018 National Fire Incident Reporting System (NFIRS) incidents
- Incident types reported to NFIRS in Edgewater, FL
- 10,18058.1%Rescue & EMS
- 2,44113.9%Service Call
- 1,92111.0%Good Intent Call
- 1,2547.2%Fire
- 1,2277.0%Hazardous Condition
- 4232.4%False Alarm
- 470.3%Special Incident
- Fire incident types reported to NFIRS in Edgewater, FL
- 57645.9%Outside Fires
- 39231.3%Structure Fires
- 18714.9%Mobile Property/Vehicle Fires
- 997.9%Other
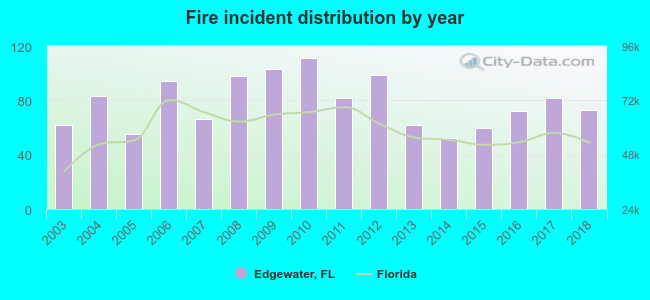 According to the data from the years 2003 - 2018 the average number of fire incidents per year is 78. The highest number of fire incidents - 111 took place in 2010, and the least - 52 in 2014. The data has a growing trend.
The average number of yearly fire incidents per 10k residents in Edgewater, FL compared to nearest cities:
(Note: Based on data for the last 3 years, including only cities with population 5,000 and above)
| Edgewater: | 35.8 |
| New Smyrna Beach: | 81.6 |
| Port Orange: | 22.2 |
| South Daytona: | 8.3 |
| Daytona Beach: | 60.0 |
| Deltona: | 25.0 |
| Mims: | 93.0 |
| Holly Hill: | 49.3 |
| Orange City: | 114.3 |
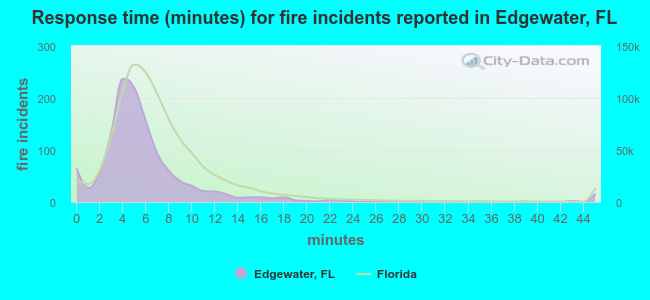 The median response time based on all reported fire incidents is 5 minutes. This is lower than the state median value.
The median response time in Edgewater, FL compared to nearest cities:
(Note: Based on data for all years, including only cities with at least 500 fire incidents)
| Edgewater: | 5 minutes |
| New Smyrna Beach: | 6 minutes |
| Port Orange: | 6 minutes |
| Daytona Beach: | 5 minutes |
| Deltona: | 6 minutes |
| Geneva: | 8 minutes |
| Mims: | 8 minutes |
| Holly Hill: | 5 minutes |
| Orange City: | 5 minutes |
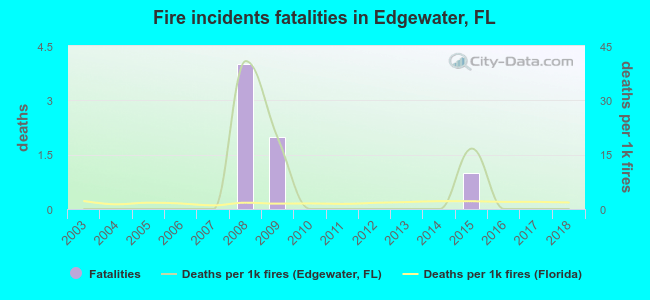 According to the data from the years 2003 - 2018 the average number of fire-related yearly deaths is 0. The highest number of deaths - 4 took place in 2008, and the lowest - 0 in 2003. The data has a constant trend.
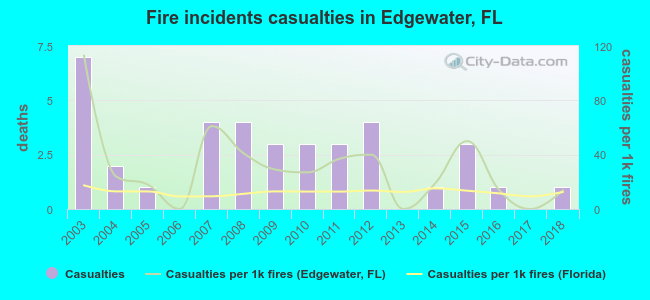 Based on the reports from the years 2003 - 2018 the average number of fire-related yearly casualties is 2. The highest number of reported casualties - 7 took place in 2003, and the lowest - 0 in 2006. The data has a dropping trend.
The average number of casualties per 1,000 fire incidents is 30. This indicator was the highest - 113 in 2003, and the lowest 0 in 2006. The trend for casualties per 1,000 fire incidents is dropping. Compared to the state value the number of casualties per 1,000 fire incidents is much higher.
Based on the reports from the years 2003 - 2018 the average number of fire-related yearly casualties is 2. The highest number of reported casualties - 7 took place in 2003, and the lowest - 0 in 2006. The data has a dropping trend.
The average number of casualties per 1,000 fire incidents is 30. This indicator was the highest - 113 in 2003, and the lowest 0 in 2006. The trend for casualties per 1,000 fire incidents is dropping. Compared to the state value the number of casualties per 1,000 fire incidents is much higher.Casualties per 1,000 incidents in Edgewater, FL compared to nearest cities:
(Note: Based on data for all years, including only cities with at least 500 fire incidents)
| Edgewater: | 29.5 |
| New Smyrna Beach: | 12.0 |
| Port Orange: | 23.4 |
| Daytona Beach: | 23.2 |
| Deltona: | 33.1 |
| Geneva: | 20.3 |
| Mims: | 12.4 |
| Holly Hill: | 16.9 |
| Orange City: | 11.2 |
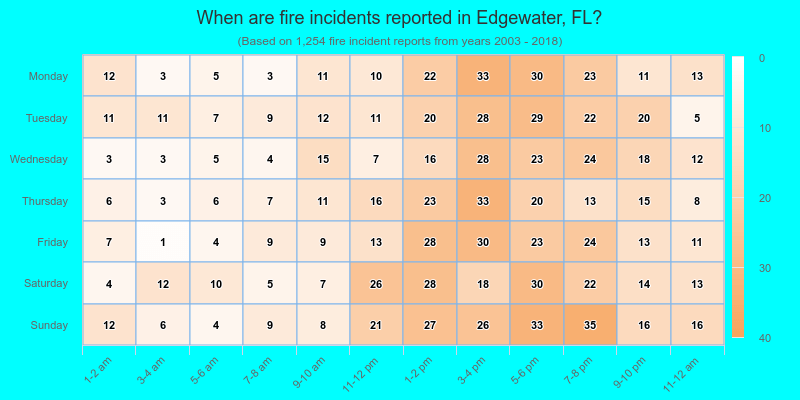
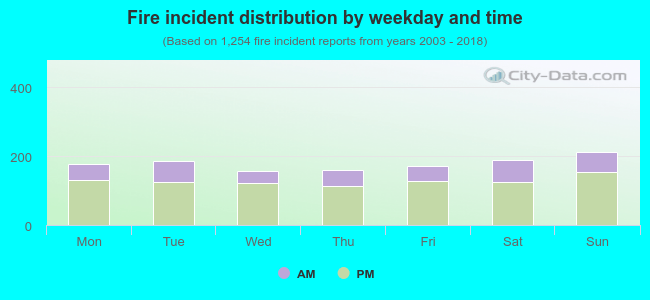 28.5% incidents where reported in the morning and 71.5% in the evening. The most fires (17.0%) took place on Sunday, and the least (12.6%) on Wednesday.
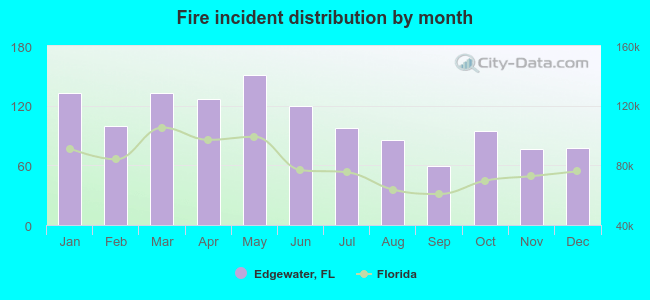 According to the 1,254 reports from years 2003 - 2018 most fires (12.0%) took place during May, and the least (4.7%) in September.
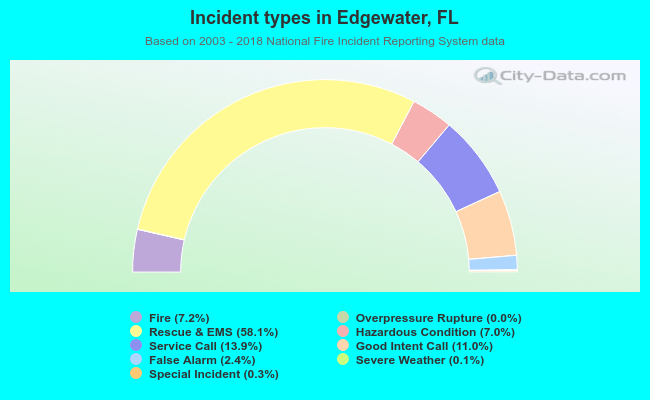 Out of all 17,511 cases reported during the years 2003 - 2018, the most belonged to the categories: Rescue & EMS (58.1%), Service Call (13.9%), and Good Intent Call (11.0%).
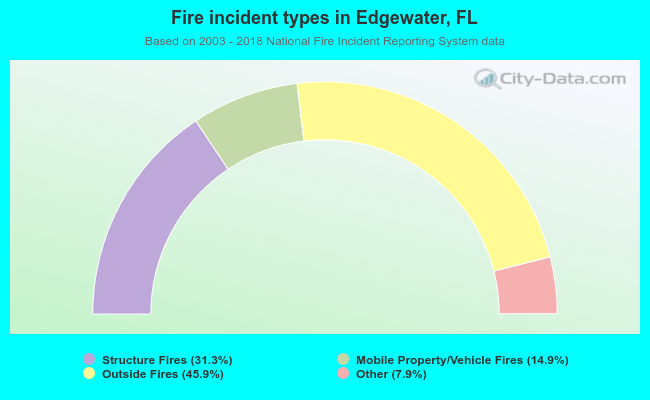 When looking into fire subcategories, the most reports belonged to: Outside Fires (45.9%), and Structure Fires (31.3%).