Edgewater, Florida
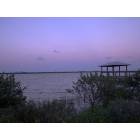
Edgewater: Edgewater sunset Riverside Dr
Edgewater: Along Riverside Drive in Edgewater at Sunrise

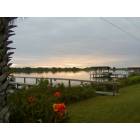
Edgewater: Sunset On the Water

Edgewater: the sun setting over the house
- add
your


Submit your own pictures of this city and show them to the world
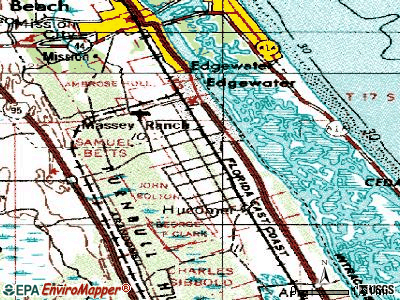
- OSM Map
- General Map
- Google Map
- MSN Map
Population change since 2000: +25.9%
 |
| Males: 11,134 | |
| Females: 12,372 |
| Median resident age: | 54.8 years |
| Florida median age: | 42.7 years |
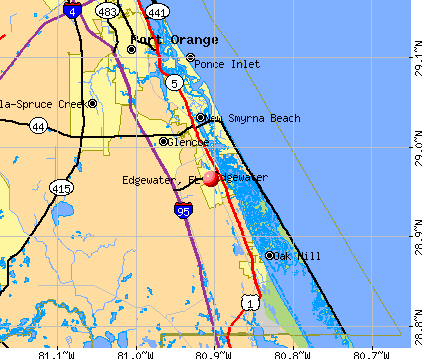
Zip codes: 32132, 32141, 32168, 32759, 33312.
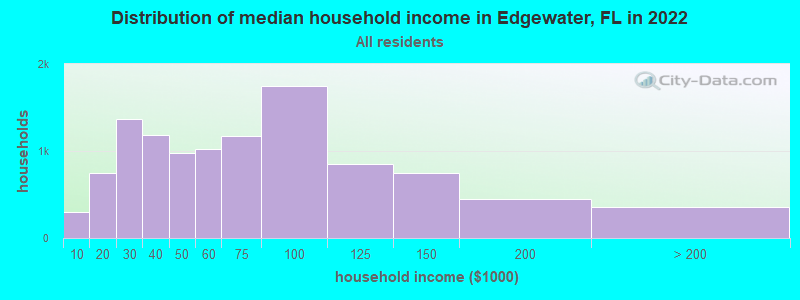
Edgewater Zip Code Map| Edgewater: | $58,493 |
| FL: | $69,303 |
Estimated per capita income in 2022: $36,254 (it was $17,017 in 2000)
Edgewater city income, earnings, and wages data
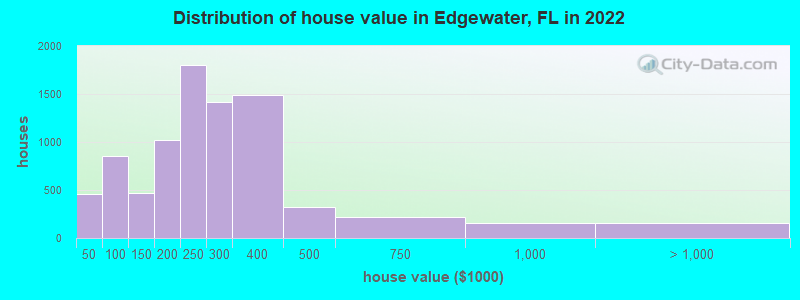
Estimated median house or condo value in 2022: $265,763 (it was $76,900 in 2000)
| Edgewater: | $265,763 |
| FL: | $354,100 |
Mean prices in 2022: all housing units: $272,374; detached houses: $294,499; townhouses or other attached units: $184,532; in 2-unit structures: $193,299; in 5-or-more-unit structures: $294,162; mobile homes: $121,097
Median gross rent in 2022: $1,402.
(10.1% for White Non-Hispanic residents, 4.0% for Black residents, 17.3% for Hispanic or Latino residents, 10.7% for other race residents, 7.5% for two or more races residents)
Detailed information about poverty and poor residents in Edgewater, FL


Compare current foreclosures near Edgewater, FL:
| Photo | Address | Area | Beds / Baths | Price | Details |
|---|---|---|---|---|---|

|
#1
Fern Palm Dr
Edgewater, FL 32141
|
1,295 sq. feet
|
1 baths 2 beds |
show details | |

|
#2
Queen Palm Dr
Edgewater, FL 32132
|
1,344 sq. feet
|
2 baths 3 beds |
show details | |

|
#3
Woodland Dr
Edgewater, FL 32141
|
1,382 sq. feet
|
3 baths 3 beds |
show details | |

|
#4
Pine Tree Dr
Edgewater, FL 32141
|
1,837 sq. feet
|
2 baths 4 beds |
show details | |

|
#5
Lime Tree Dr
Edgewater, FL 32141
|
2,000 sq. feet
|
2 baths 3 beds |
show details | |

|
#6
Tamarind Dr
Edgewater, FL 32141
|
1,260 sq. feet
|
3 baths 3 beds |
show details | |

|
#7
Royal Palm Dr
Edgewater, FL 32141
|
1,347 sq. feet
|
3 baths 2 beds |
show details | |

|
#8
4th St
Edgewater, FL 32132
|
792 sq. feet
|
1 baths 2 beds |
show details | |

|
#9
Azalea Rd
Edgewater, FL 32141
|
1,759 sq. feet
|
3 baths 3 beds |
show details | |

|
#10
Victory Palm Dr
Edgewater, FL 32141
|
1,226 sq. feet
|
2 baths 3 beds |
show details |
| Photo | Address | Area | Beds / Baths | Price | Details |
|---|---|---|---|---|---|

|
#11
Sabal Palm Dr
Edgewater, FL 32132
|
2,000 sq. feet
|
2 baths 3 beds |
show details | |

|
#12
Lukas Ln
Edgewater, FL 32132
|
2,938 sq. feet
|
3 baths 4 beds |
show details | |

|
#13
Needle Palm Dr
Edgewater, FL 32141
|
1,260 sq. feet
|
3 baths 3 beds |
show details | |

|
#14
Woodland Dr
Edgewater, FL 32141
|
1,280 sq. feet
|
3 baths 3 beds |
show details | |

|
#15
Royal Palm Dr
Edgewater, FL 32132
|
1,559 sq. feet
|
1 baths 3 beds |
show details | |

|
#16
India Palm Dr
Edgewater, FL 32141
|
1,208 sq. feet
|
3 baths 3 beds |
show details | |

|
#17
Lake Ave
Edgewater, FL 32132
|
937 sq. feet
|
1 baths 3 beds |
show details | |

|
#18
Umbrella Tree Dr
Edgewater, FL 32132
|
1,401 sq. feet
|
2 baths 3 beds |
show details | |

|
#19
Orange Tree Dr
Edgewater, FL 32141
|
1,708 sq. feet
|
2 baths 3 beds |
show details | |

|
#20
Kingfisher Ln
Edgewater, FL 32141
|
1,038 sq. feet
|
3 baths 2 beds |
show details |
| Photo | Address | Area | Beds / Baths | Price | Details |
|---|---|---|---|---|---|

|
#21
Yule Tree Dr
Edgewater, FL 32141
|
1,312 sq. feet
|
3 baths 2 beds |
show details | |

|
#22
Willow Oak Dr
Edgewater, FL 32141
|
1,442 sq. feet
|
3 baths 3 beds |
show details | |

|
#23
Banyan Tree Dr
Edgewater, FL 32141
|
- sq. feet
|
- baths - beds |
show details | |

|
#24
N Ridgewood Ave Lot 31
Edgewater, FL 32132
|
- sq. feet
|
- baths - beds |
show details | |

|
#25
Rio Grande
Edgewater, FL 32141
|
- sq. feet
|
- baths - beds |
show details | |

|
#26
S Riverside Dr
Edgewater, FL 32132
|
- sq. feet
|
- baths - beds |
show details | |

|
#27
Sherman Rd
Daytona Beach, FL 32119
|
1,426 sq. feet
|
2 baths 3 beds |
show details | |

|
#28
Rush St
New Smyrna Beach, FL 32168
|
1,970 sq. feet
|
2 baths 4 beds |
show details | |

|
#29
N Brooks Cir
Oak Hill, FL 32759
|
1,620 sq. feet
|
2 baths 3 beds |
show details | |

|
#30
Melonie Trl
New Smyrna Beach, FL 32168
|
2,541 sq. feet
|
2 baths 3 beds |
show details |
| Photo | Address | Area | Beds / Baths | Price | Details |
|---|---|---|---|---|---|

|
#31
Scarlett Trl
New Smyrna Beach, FL 32168
|
2,352 sq. feet
|
2 baths 3 beds |
show details | |

|
#32
Halifax Dr
Port Orange, FL 32128
|
2,054 sq. feet
|
3 baths 3 beds |
show details | |

|
#33
Deskin Dr
Daytona Beach, FL 32119
|
1,796 sq. feet
|
3 baths 3 beds |
show details | |

|
#34
Southwinds Dr
Port Orange, FL 32129
|
1,782 sq. feet
|
2 baths 3 beds |
show details | |

|
#35
Florida Blvd
Daytona Beach, FL 32119
|
988 sq. feet
|
3 baths 2 beds |
show details | |

|
#36
Brandy Hills Dr
Port Orange, FL 32129
|
1,191 sq. feet
|
3 baths 2 beds |
show details | |

|
#37
Florida Blvd
Daytona Beach, FL 32119
|
1,200 sq. feet
|
3 baths 4 beds |
show details | |

|
#38
Florida Blvd
Daytona Beach, FL 32119
|
1,140 sq. feet
|
3 baths 3 beds |
show details | |

|
#39
Magnolia Ave
Daytona Beach, FL 32119
|
1,859 sq. feet
|
3 baths 3 beds |
show details | |

|
#40
Florida Blvd
Daytona Beach, FL 32119
|
784 sq. feet
|
1 baths 2 beds |
show details |
| Photo | Address | Area | Beds / Baths | Price | Details |
|---|---|---|---|---|---|

|
#41
Sherwood Dr
Daytona Beach, FL 32119
|
1,310 sq. feet
|
3 baths 3 beds |
show details | |

|
#42
Green Acres Cir N
Daytona Beach, FL 32119
|
672 sq. feet
|
3 baths 2 beds |
show details | |

|
#43
Halifax Dr
Port Orange, FL 32128
|
2,054 sq. feet
|
3 baths 3 beds |
show details | |

|
#44
Brom Bones Ct
Port Orange, FL 32127
|
2,008 sq. feet
|
3 baths 3 beds |
show details | |

|
#45
Ana Maria Cir
Port Orange, FL 32129
|
1,133 sq. feet
|
3 baths 2 beds |
show details | |

|
#46
Sleepy Hollow Dr
Port Orange, FL 32127
|
1,566 sq. feet
|
2 baths 3 beds |
show details | |

|
#47
Sydney St
Port Orange, FL 32127
|
1,782 sq. feet
|
3 baths 2 beds |
show details | |

|
#48
Clear Lake Dr
Port Orange, FL 32127
|
2,039 sq. feet
|
2 baths 3 beds |
show details | |

|
#49
Belleflower Dr
Port Orange, FL 32127
|
1,840 sq. feet
|
2 baths 3 beds |
show details | |

|
Check over 1 million property listings on Foreclosure.com!
|
browse all offers | |||


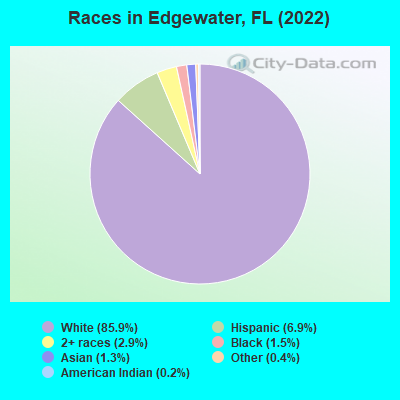
- 20,60385.9%White alone
- 1,6516.9%Hispanic
- 7022.9%Two or more races
- 3661.5%Black alone
- 3161.3%Asian alone
- 1070.4%Other race alone
- 590.2%American Indian alone
Races in Edgewater detailed stats: ancestries, foreign born residents, place of birth
According to our research of Florida and other state lists, there were 31 registered sex offenders living in Edgewater, Florida as of May 09, 2024.
The ratio of all residents to sex offenders in Edgewater is 712 to 1.
The ratio of registered sex offenders to all residents in this city is near the state average.
Type |
2009 |
2010 |
2011 |
2012 |
2013 |
2014 |
2015 |
2016 |
2017 |
2018 |
2019 |
2020 |
|---|---|---|---|---|---|---|---|---|---|---|---|---|
| Murders (per 100,000) | 1 (4.6) | 0 (0.0) | 4 (19.0) | 0 (0.0) | 1 (4.8) | 0 (0.0) | 0 (0.0) | 0 (0.0) | 1 (4.5) | 0 (0.0) | 0 (0.0) | 0 (0.0) |
| Rapes (per 100,000) | 4 (18.4) | 3 (14.5) | 0 (0.0) | 2 (9.5) | 0 (0.0) | 0 (0.0) | 0 (0.0) | 0 (0.0) | 0 (0.0) | 1 (4.4) | 0 (0.0) | 0 (0.0) |
| Robberies (per 100,000) | 9 (41.4) | 10 (48.2) | 11 (52.3) | 11 (52.3) | 3 (14.4) | 5 (23.8) | 3 (14.1) | 1 (4.6) | 7 (31.4) | 5 (22.1) | 1 (4.4) | 0 (0.0) |
| Assaults (per 100,000) | 46 (211.8) | 37 (178.3) | 30 (142.6) | 27 (128.3) | 17 (81.7) | 38 (181.1) | 34 (160.3) | 20 (92.0) | 20 (89.7) | 19 (83.9) | 21 (91.6) | 32 (132.4) |
| Burglaries (per 100,000) | 186 (856.6) | 199 (959.0) | 134 (637.1) | 138 (655.8) | 149 (715.7) | 85 (405.0) | 108 (509.1) | 46 (211.7) | 100 (448.4) | 65 (287.1) | 108 (471.1) | 93 (384.8) |
| Thefts (per 100,000) | 366 (1,686) | 399 (1,923) | 359 (1,707) | 360 (1,711) | 395 (1,897) | 280 (1,334) | 275 (1,296) | 187 (860.6) | 344 (1,543) | 306 (1,351) | 224 (977.1) | 255 (1,055) |
| Auto thefts (per 100,000) | 39 (179.6) | 35 (168.7) | 23 (109.4) | 28 (133.1) | 32 (153.7) | 28 (133.4) | 16 (75.4) | 15 (69.0) | 30 (134.5) | 39 (172.2) | 29 (126.5) | 28 (115.9) |
| Arson (per 100,000) | 4 (18.4) | 4 (19.3) | 2 (9.5) | 0 (0.0) | 0 (0.0) | 0 (0.0) | 0 (0.0) | 2 (9.2) | 4 (17.9) | 3 (13.2) | 0 (0.0) | 0 (0.0) |
| City-Data.com crime index | 220.5 | 219.2 | 203.9 | 173.9 | 168.5 | 135.8 | 129.8 | 74.6 | 140.2 | 114.9 | 101.8 | 104.9 |
The City-Data.com crime index weighs serious crimes and violent crimes more heavily. Higher means more crime, U.S. average is 246.1. It adjusts for the number of visitors and daily workers commuting into cities.
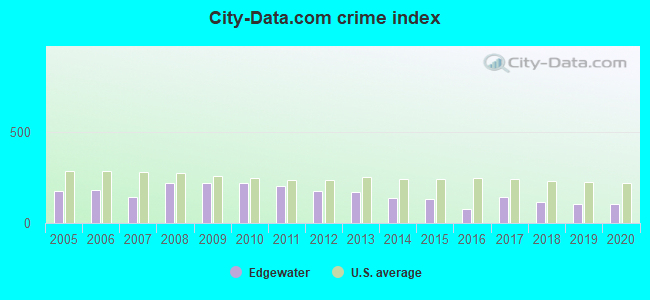
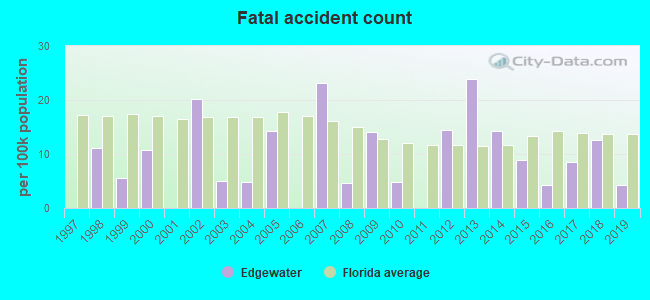
Crime rate in Edgewater detailed stats: murders, rapes, robberies, assaults, burglaries, thefts, arson
Full-time law enforcement employees in 2021, including police officers: 34 (29 officers - 26 male; 3 female).
| Officers per 1,000 residents here: | 1.19 |
| Florida average: | 2.33 |
 Recent articles from our blog. Our writers, many of them Ph.D. graduates or candidates, create easy-to-read articles on a wide variety of topics.


 | Edgewater is at the Pulse of Miami (10 replies) |
| Edgewater Apartment Recommendations (3 replies) |
| Moving from Edgewater to Brickell - condo recs (4 replies) |
| Researching New Condo Buildings in Miami (57 replies) |
| Edgewater Dr Closing March 2 (262 replies) |
| Living in Edgewater (6 replies) |
Latest news from Edgewater, FL collected exclusively by city-data.com from local newspapers, TV, and radio stations
Ancestries: American (19.3%), English (13.0%), Irish (10.2%), German (8.0%), Italian (5.6%), European (2.5%).
Current Local Time: EST time zone
Elevation: 6 feet
Land area: 9.97 square miles.
Population density: 2,358 people per square mile (low).
1,456 residents are foreign born (2.9% Europe, 1.6% Latin America, 1.1% Asia).
| This city: | 6.1% |
| Florida: | 21.1% |
Median real estate property taxes paid for housing units with mortgages in 2022: $1,680 (0.6%)
Median real estate property taxes paid for housing units with no mortgage in 2022: $1,086 (0.5%)
Nearest city with pop. 50,000+: Daytona Beach, FL  (18.7 miles , pop. 64,112).
Nearest city with pop. 200,000+: Jacksonville, FL (104.2 miles , pop. 735,617).
Nearest city with pop. 1,000,000+: Philadelphia, PA (830.4 miles , pop. 1,517,550).
Nearest cities:
), ), ), ), )Latitude: 28.96 N, Longitude: 80.90 W
Daytime population change due to commuting: -3,322 (-13.8%)
Workers who live and work in this city: 3,644 (35.0%)
Area code commonly used in this area: 386
Edgewater, Florida accommodation & food services, waste management - Economy and Business Data
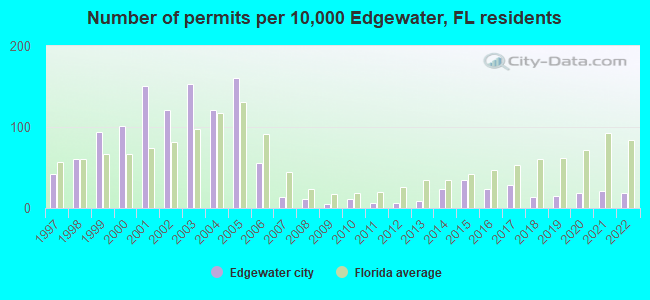
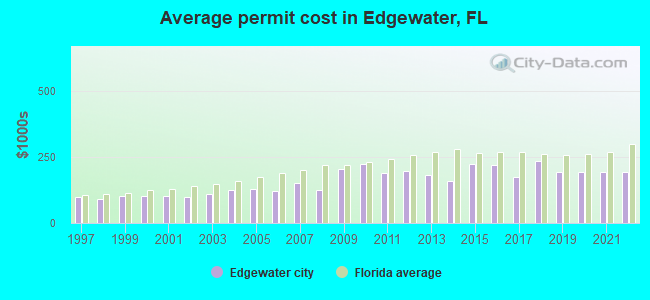
Single-family new house construction building permits:
- 2022: 33 buildings, average cost: $191,500
- 2021: 40 buildings, average cost: $191,500
- 2020: 35 buildings, average cost: $191,500
- 2019: 28 buildings, average cost: $191,500
- 2018: 27 buildings, average cost: $234,100
- 2017: 54 buildings, average cost: $173,600
- 2016: 44 buildings, average cost: $220,100
- 2015: 63 buildings, average cost: $224,100
- 2014: 45 buildings, average cost: $157,900
- 2013: 16 buildings, average cost: $181,700
- 2012: 11 buildings, average cost: $197,200
- 2011: 12 buildings, average cost: $191,200
- 2010: 21 buildings, average cost: $225,100
- 2009: 10 buildings, average cost: $205,700
- 2008: 20 buildings, average cost: $125,500
- 2007: 26 buildings, average cost: $153,300
- 2006: 103 buildings, average cost: $120,500
- 2005: 301 buildings, average cost: $130,700
- 2004: 226 buildings, average cost: $126,400
- 2003: 285 buildings, average cost: $108,700
- 2002: 226 buildings, average cost: $100,200
- 2001: 281 buildings, average cost: $101,000
- 2000: 189 buildings, average cost: $101,900
- 1999: 175 buildings, average cost: $101,500
- 1998: 114 buildings, average cost: $89,800
- 1997: 78 buildings, average cost: $98,500
| Here: | 3.3% |
| Florida: | 2.9% |
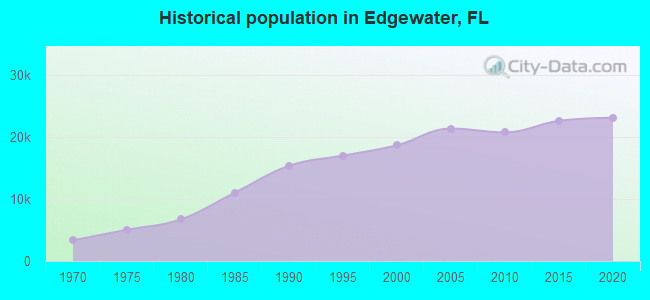
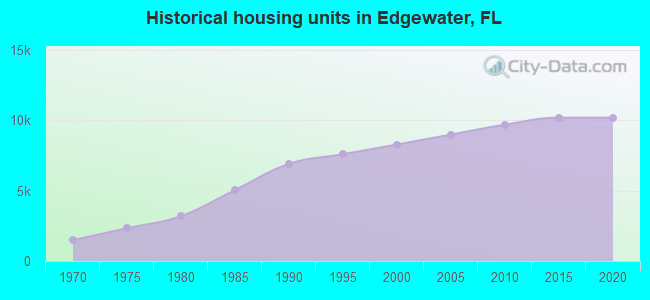
Population change in the 1990s: +2,908 (+18.5%).
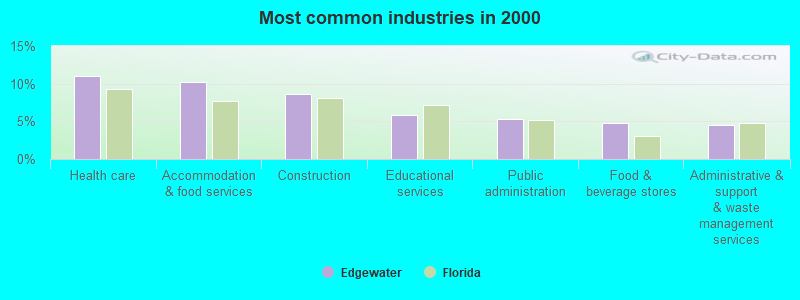
- Health care (11.1%)
- Accommodation & food services (10.2%)
- Construction (8.6%)
- Educational services (5.9%)
- Public administration (5.4%)
- Food & beverage stores (4.7%)
- Administrative & support & waste management services (4.5%)
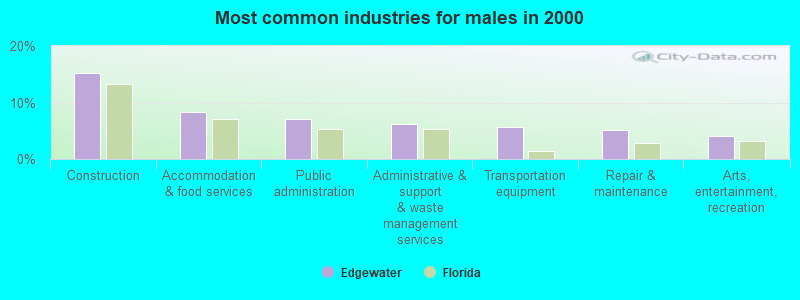
- Construction (15.1%)
- Accommodation & food services (8.3%)
- Public administration (7.0%)
- Administrative & support & waste management services (6.3%)
- Transportation equipment (5.6%)
- Repair & maintenance (5.1%)
- Arts, entertainment, recreation (4.0%)
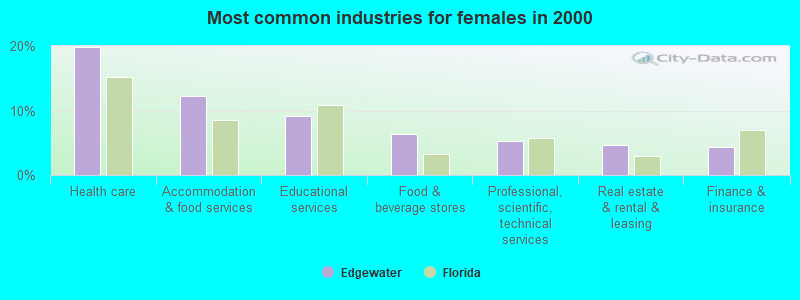
- Health care (19.8%)
- Accommodation & food services (12.2%)
- Educational services (9.2%)
- Food & beverage stores (6.4%)
- Professional, scientific, technical services (5.2%)
- Real estate & rental & leasing (4.7%)
- Finance & insurance (4.4%)
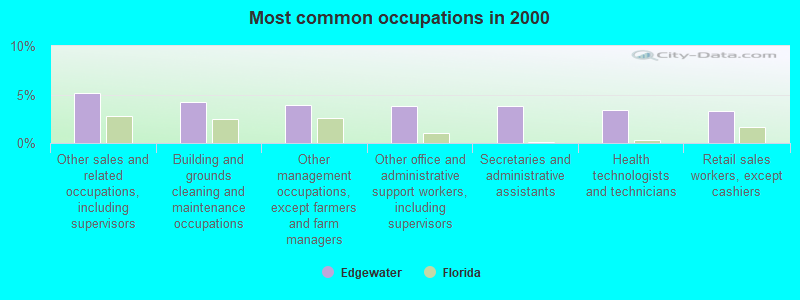
- Other sales and related occupations, including supervisors (5.1%)
- Building and grounds cleaning and maintenance occupations (4.2%)
- Other management occupations, except farmers and farm managers (4.0%)
- Other office and administrative support workers, including supervisors (3.8%)
- Secretaries and administrative assistants (3.8%)
- Health technologists and technicians (3.5%)
- Retail sales workers, except cashiers (3.3%)
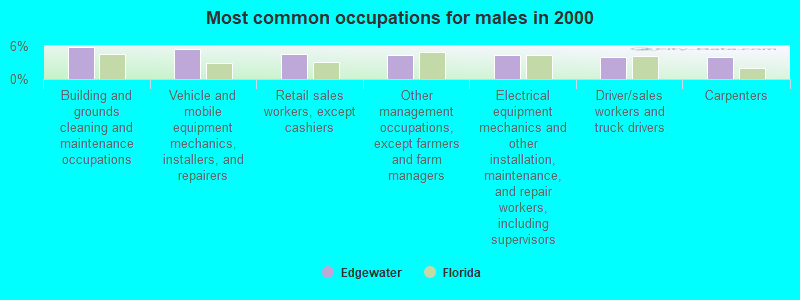
- Building and grounds cleaning and maintenance occupations (5.8%)
- Vehicle and mobile equipment mechanics, installers, and repairers (5.5%)
- Retail sales workers, except cashiers (4.5%)
- Other management occupations, except farmers and farm managers (4.3%)
- Electrical equipment mechanics and other installation, maintenance, and repair workers, including supervisors (4.3%)
- Driver/sales workers and truck drivers (4.1%)
- Carpenters (4.0%)
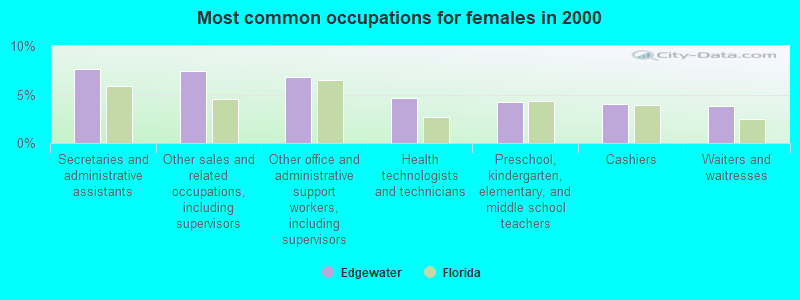
- Secretaries and administrative assistants (7.6%)
- Other sales and related occupations, including supervisors (7.5%)
- Other office and administrative support workers, including supervisors (6.8%)
- Health technologists and technicians (4.6%)
- Preschool, kindergarten, elementary, and middle school teachers (4.3%)
- Cashiers (4.1%)
- Waiters and waitresses (3.8%)
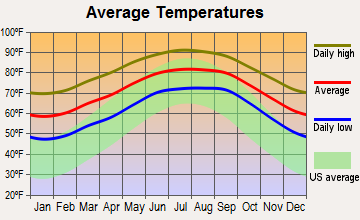
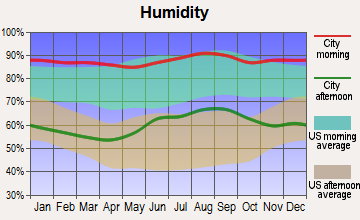
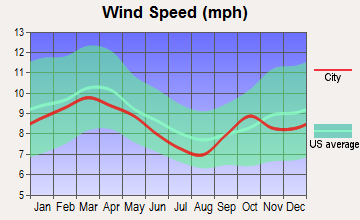
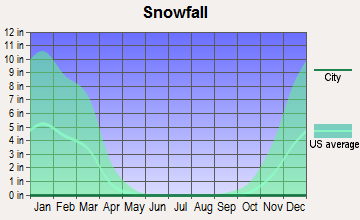
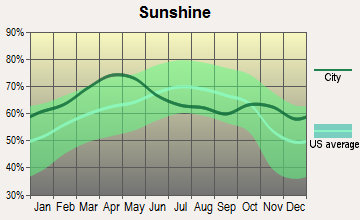
Average climate in Edgewater, Florida
Based on data reported by over 4,000 weather stations

(lower is better)
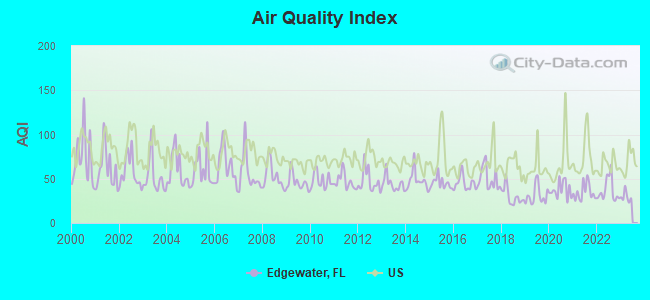
Air Quality Index (AQI) level in 2022 was 36.9. This is significantly better than average.
| City: | 36.9 |
| U.S.: | 72.6 |
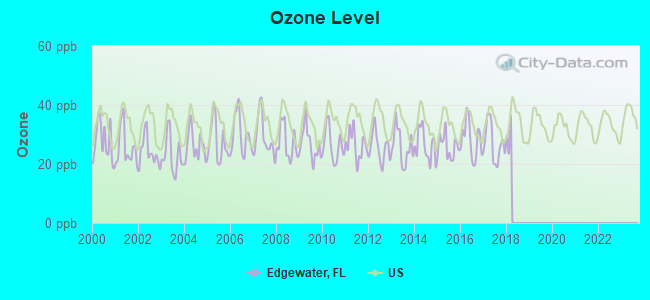
Ozone [ppb] level in 2017 was 27.1. This is better than average. Closest monitor was 11.4 miles away from the city center.
| City: | 27.1 |
| U.S.: | 33.3 |
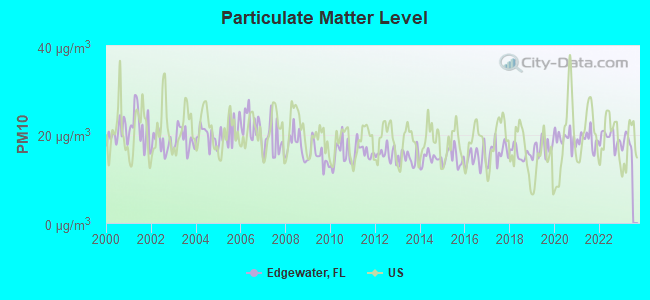
Particulate Matter (PM10) [µg/m3] level in 2022 was 19.2. This is about average. Closest monitor was 19.0 miles away from the city center.
| City: | 19.2 |
| U.S.: | 19.2 |
Tornado activity:
Edgewater-area historical tornado activity is near Florida state average. It is 4% greater than the overall U.S. average.
On 11/1/1997, a category F3 (max. wind speeds 158-206 mph) tornado 4.2 miles away from the Edgewater city center injured 32 people and caused $14 million in damages.
On 4/4/1966, a category F4 (max. wind speeds 207-260 mph) tornado 39.6 miles away from the city center killed 11 people and injured 530 people and caused between $5,000,000 and $50,000,000 in damages.
Earthquake activity:
Edgewater-area historical earthquake activity is significantly above Florida state average. It is 88% smaller than the overall U.S. average.On 9/10/2006 at 14:56:08, a magnitude 5.9 (5.9 MB, 5.5 MS, 5.8 MW, Class: Moderate, Intensity: VI - VII) earthquake occurred 397.9 miles away from Edgewater center
On 11/22/1974 at 05:25:55, a magnitude 4.7 (4.7 MB, Class: Light, Intensity: IV - V) earthquake occurred 276.0 miles away from Edgewater center
On 6/23/2016 at 17:20:29, a magnitude 3.8 (3.8 ML, Class: Light, Intensity: II - III) earthquake occurred 113.0 miles away from Edgewater center
On 9/4/2016 at 18:29:29, a magnitude 3.8 (3.8 ML) earthquake occurred 113.4 miles away from Edgewater center
On 9/21/2016 at 16:30:52, a magnitude 3.8 (3.8 ML) earthquake occurred 114.0 miles away from Edgewater center
On 7/16/2016 at 20:00:10, a magnitude 3.7 (3.7 MB) earthquake occurred 104.5 miles away from Edgewater center
Magnitude types: body-wave magnitude (MB), local magnitude (ML), surface-wave magnitude (MS), moment magnitude (MW)
Natural disasters:
The number of natural disasters in Volusia County (27) is a lot greater than the US average (15).Major Disasters (Presidential) Declared: 17
Emergencies Declared: 5
Causes of natural disasters: Hurricanes: 13, Tornadoes: 7, Floods: 6, Storms: 5, Tropical Storms: 4, Fires: 3, Winds: 2, Freeze: 1, Heavy Rain: 1, Other: 1 (Note: some incidents may be assigned to more than one category).
Hospitals and medical centers near Edgewater:
- OCEAN VIEW NURSING AND REHABILITATION CENTER, LLC (Nursing Home, about 4 miles away; NEW SMYRNA BEACH, FL)
- BERT FISH MEDICAL CENTER Acute Care Hospitals (about 5 miles away; NEW SMYRNA BEACH, FL)
- NEW SMYRNA BEACH AKC (Dialysis Facility, about 5 miles away; NEW SMYRNA BEACH, FL)
- NEW SMYRNA BEACH DIALYSIS (Dialysis Facility, about 5 miles away; NEW SMYRNA BEACH, FL)
- HOSPICE OF VOLUSIA FLAGLER (Hospital, about 14 miles away; PORT ORANGE, FL)
- DAYTONA MANOR NH (Nursing Home, about 15 miles away; DAYTONA BEACH, FL)
- OAKTREE HEALTHCARE (Nursing Home, about 15 miles away; SOUTH DAYTONA, FL)
Colleges/universities with over 2000 students nearest to Edgewater:
- Embry-Riddle Aeronautical University-Daytona Beach (about 18 miles; Daytona Beach, FL; Full-time enrollment: 4,932)
- Embry-Riddle Aeronautical University-Worldwide (about 18 miles; Daytona Beach, FL; FT enrollment: 9,244)
- Bethune-Cookman University (about 19 miles; Daytona Beach, FL; FT enrollment: 3,733)
- Daytona State College (about 19 miles; Daytona Beach, FL; FT enrollment: 11,389)
- Stetson University (about 25 miles; DeLand, FL; FT enrollment: 2,956)
- Seminole State College of Florida (about 29 miles; Sanford, FL; FT enrollment: 14,124)
- Wyotech-Daytona (about 31 miles; Ormond Beach, FL; FT enrollment: 2,295)
Public elementary/middle schools in Edgewater:
- INDIAN RIVER ELEMENTARY SCHOOL (Students: 428, Location: 650 ROBERTS RD, Grades: PK-5)
- EDGEWATER PUBLIC SCHOOL (Students: 288, Location: 801 S OLD COUNTY RD, Grades: PK-5)
User-submitted facts and corrections:
- Edgewater, Florida's website is cityofedgewater.org
Points of interest:
Notable locations in Edgewater: Edgewater Plaza (A), Edgewater Department of Fire Rescue Station 55 (B), Edgewater Department of Fire Rescue Station 57 (C), Edgewater Police Department (D), Edgewater Public Library (E). Display/hide their locations on the map
Shopping Center: Daytona Beach Outlet Mall (1). Display/hide its location on the map
Churches in Edgewater include: Indian River Baptist Church (A), Edgewater United Methodist Church (B), Edgewater First Baptist Church (C), Edgewater Alliance Church (D), Bella Vista Baptist Church (E). Display/hide their locations on the map
Cemetery: Sea Pines Memorial Gardens (1). Display/hide its location on the map
Hotels: Cheaper By The Dozen (2020 Limetree Drive) (1), All-Suite Motel (335 North Ridgewood Avenue) (2), Carter's Motel & Mobile Village (2450 South Ridgewood Avenue) (3). Display/hide their approximate locations on the map
Birthplace of: David Kilgore - College basketball player (Stetson Hatters).
Drinking water stations with addresses in Edgewater that have no violations reported:
| This city: | 2.4 people |
| Florida: | 2.5 people |
| This city: | 66.6% |
| Whole state: | 65.2% |
| This city: | 9.0% |
| Whole state: | 7.3% |
Likely homosexual households (counted as self-reported same-sex unmarried-partner households)
- Lesbian couples: 0.4% of all households
- Gay men: 0.4% of all households
38 people in nursing homes in 2000
14 people in other noninstitutional group quarters in 2000
Banks with branches in Edgewater (2011 data):
- Wells Fargo Bank, National Association: Edgewater Branch at 1813 South Ridgewood Avenue, branch established on 1981/12/07. Info updated 2011/04/05: Bank assets: $1,161,490.0 mil, Deposits: $905,653.0 mil, headquarters in Sioux Falls, SD, positive income, 6395 total offices, Holding Company: Wells Fargo & Company
- TD Bank, National Association: Edgewater Branch at 2130 S Ridgewood Ave, branch established on 1997/06/09. Info updated 2010/10/04: Bank assets: $188,912.6 mil, Deposits: $153,149.8 mil, headquarters in Wilmington, DE, positive income, 1314 total offices, Holding Company: Toronto-Dominion Bank, The
- Friends Bank: Edgewater Office at 1504 South Ridgewood Avenue, branch established on 2004/02/23. Info updated 2006/11/03: Bank assets: $122.7 mil, Deposits: $115.7 mil, headquarters in New Smyrna Beach, FL, negative income in the last year, Commercial Lending Specialization, 3 total offices
- Bank of America, National Association: Edgewater Branch at 1900 South Ridgewood Avenue, branch established on 1991/01/16. Info updated 2009/11/18: Bank assets: $1,451,969.3 mil, Deposits: $1,077,176.8 mil, headquarters in Charlotte, NC, positive income, 5782 total offices, Holding Company: Bank Of America Corporation
- Regions Bank: Edgewater Branch at 1304 South Ridgewood Avenue, branch established on 1935/07/17. Info updated 2011/02/24: Bank assets: $123,368.2 mil, Deposits: $98,301.3 mil, headquarters in Birmingham, AL, positive income, Commercial Lending Specialization, 1778 total offices, Holding Company: Regions Financial Corporation
- SunTrust Bank: Edgewater Branch at 512 North Ridgewood Avenue, branch established on 1986/02/03. Info updated 2010/05/27: Bank assets: $171,291.7 mil, Deposits: $129,833.2 mil, headquarters in Atlanta, GA, positive income, Commercial Lending Specialization, 1716 total offices, Holding Company: Suntrust Banks, Inc.
For population 15 years and over in Edgewater:
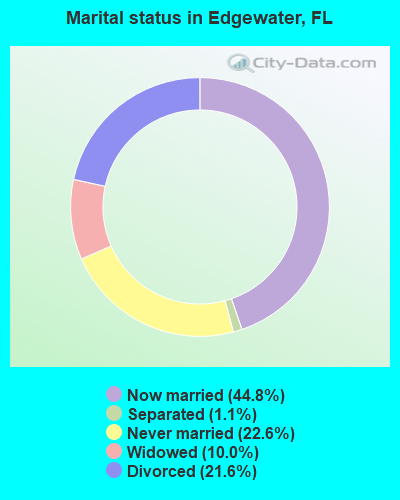
- Never married: 22.6%
- Now married: 44.8%
- Separated: 1.1%
- Widowed: 10.0%
- Divorced: 21.6%
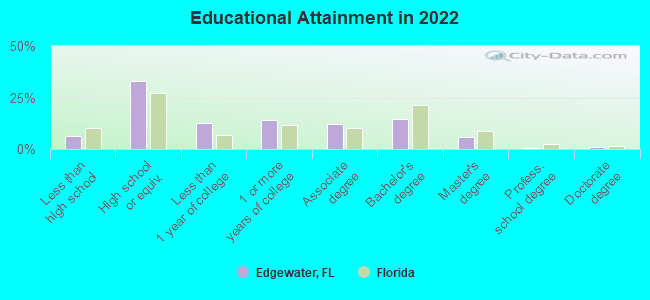
For population 25 years and over in Edgewater:
- High school or higher: 92.7%
- Bachelor's degree or higher: 20.8%
- Graduate or professional degree: 6.5%
- Unemployed: 4.0%
- Mean travel time to work (commute): 22.7 minutes
| Here: | 9.1 |
| Florida average: | 12.2 |
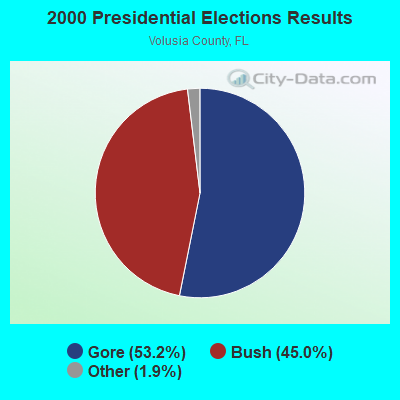
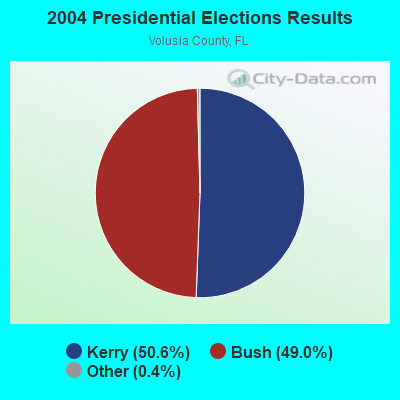
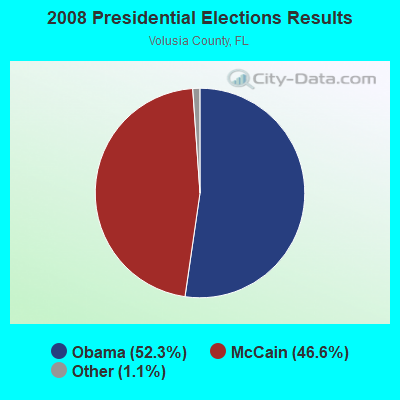
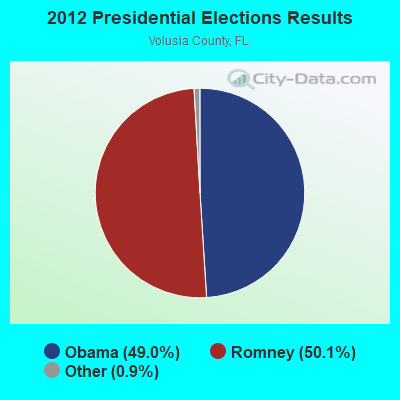
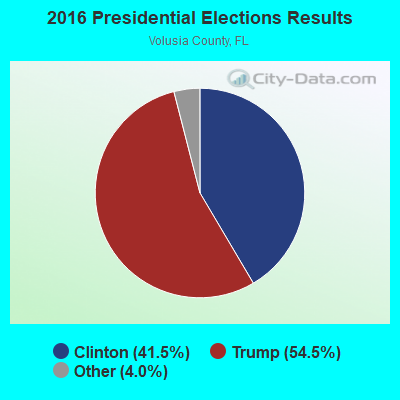
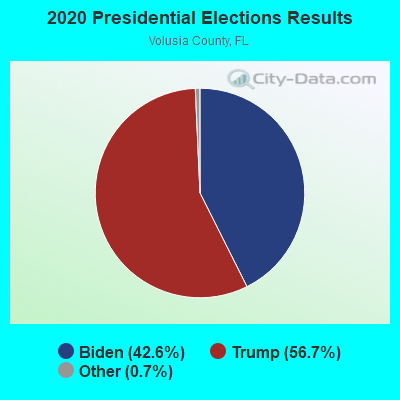
Graphs represent county-level data. Detailed 2008 Election Results
Religion statistics for Edgewater, FL (based on Volusia County data)
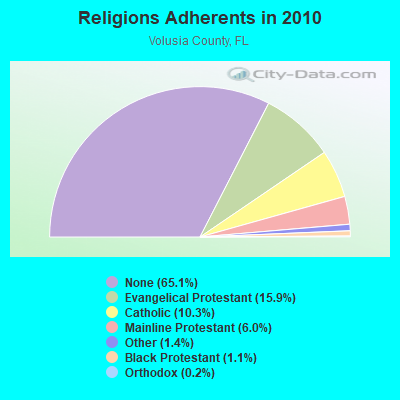
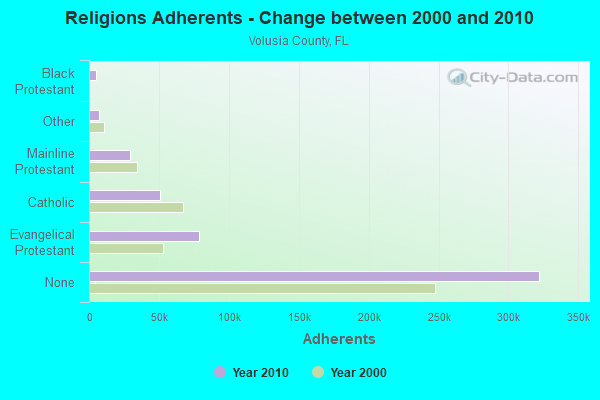
| Religion | Adherents | Congregations |
|---|---|---|
| Evangelical Protestant | 78,423 | 255 |
| Catholic | 50,934 | 15 |
| Mainline Protestant | 29,546 | 77 |
| Other | 7,075 | 39 |
| Black Protestant | 5,253 | 34 |
| Orthodox | 1,206 | 5 |
| None | 322,156 | - |
Food Environment Statistics:
| Volusia County: | 1.80 / 10,000 pop. |
| State: | 2.04 / 10,000 pop. |
| This county: | 0.12 / 10,000 pop. |
| State: | 0.11 / 10,000 pop. |
| Volusia County: | 1.52 / 10,000 pop. |
| Florida: | 1.28 / 10,000 pop. |
| This county: | 3.60 / 10,000 pop. |
| State: | 3.04 / 10,000 pop. |
| Volusia County: | 7.50 / 10,000 pop. |
| Florida: | 7.45 / 10,000 pop. |
| This county: | 9.1% |
| State: | 9.2% |
| Here: | 24.5% |
| Florida: | 23.7% |
| Volusia County: | 14.1% |
| Florida: | 14.0% |
Health and Nutrition:
| This city: | 50.3% |
| Florida: | 51.4% |
| Here: | 46.1% |
| Florida: | 49.4% |
| Edgewater: | 29.1 |
| Florida: | 28.6 |
| This city: | 21.3% |
| Florida: | 19.5% |
| This city: | 11.9% |
| Florida: | 10.7% |
| Here: | 6.9 |
| State: | 6.9 |
| This city: | 36.2% |
| Florida: | 34.7% |
| This city: | 55.2% |
| Florida: | 57.0% |
| Here: | 75.5% |
| Florida: | 79.2% |
More about Health and Nutrition of Edgewater, FL Residents
| Local government employment and payroll (March 2022) | |||||
| Function | Full-time employees | Monthly full-time payroll | Average yearly full-time wage | Part-time employees | Monthly part-time payroll |
|---|---|---|---|---|---|
| Water Supply | 26 | $120,938 | $55,818 | 0 | $0 |
| Firefighters | 25 | $136,607 | $65,571 | 0 | $0 |
| Police Protection - Officers | 25 | $130,339 | $62,563 | 0 | $0 |
| Parks and Recreation | 21 | $150,555 | $86,031 | 1 | $997 |
| Other Government Administration | 16 | $69,415 | $52,061 | 1 | $1,993 |
| Financial Administration | 15 | $69,534 | $55,627 | 0 | $0 |
| Sewerage | 15 | $75,078 | $60,062 | 0 | $0 |
| Solid Waste Management | 13 | $50,605 | $46,712 | 0 | $0 |
| Other and Unallocable | 11 | $44,429 | $48,468 | 0 | $0 |
| Police - Other | 9 | $41,320 | $55,093 | 0 | $0 |
| Natural Resources | 7 | $24,231 | $41,539 | 0 | $0 |
| Fire - Other | 7 | $18,528 | $31,762 | 0 | $0 |
| Streets and Highways | 4 | $17,393 | $52,179 | 0 | $0 |
| Totals for Government | 194 | $948,973 | $58,699 | 2 | $2,989 |
Edgewater government finances - Expenditure in 2017 (per resident):
- Construction - Water Utilities: $1,507,000 ($64.11)
- Current Operations - Police Protection: $3,524,000 ($149.92)
Local Fire Protection: $3,441,000 ($146.39)
Sewerage: $3,118,000 ($132.65)
Solid Waste Management: $2,514,000 ($106.95)
Water Utilities: $2,339,000 ($99.51)
Financial Administration: $2,254,000 ($95.89)
Central Staff Services: $1,703,000 ($72.45)
Natural Resources - Other: $1,328,000 ($56.50)
Parks and Recreation: $1,266,000 ($53.86)
Regular Highways: $1,051,000 ($44.71)
General - Other: $706,000 ($30.03)
Judicial and Legal Services: $158,000 ($6.72)
- General - Interest on Debt: $69,000 ($2.94)
- Other Capital Outlay - General - Other: $1,250,000 ($53.18)
- Water Utilities - Interest on Debt: $472,000 ($20.08)
Edgewater government finances - Revenue in 2017 (per resident):
- Charges - Sewerage: $5,188,000 ($220.71)
Solid Waste Management: $2,951,000 ($125.54)
Other: $1,671,000 ($71.09)
Natural Resources - Other: $1,466,000 ($62.37)
- Federal Intergovernmental - Other: $434,000 ($18.46)
Highways: $120,000 ($5.11)
Public Welfare: $68,000 ($2.89)
- Local Intergovernmental - Other: $73,000 ($3.11)
- Miscellaneous - General Revenue - Other: $855,000 ($36.37)
Fines and Forfeits: $267,000 ($11.36)
Special Assessments: $160,000 ($6.81)
Sale of Property: $95,000 ($4.04)
Interest Earnings: $46,000 ($1.96)
Rents: $42,000 ($1.79)
- Revenue - Water Utilities: $4,096,000 ($174.25)
- State Intergovernmental - General Local Government Support: $1,730,000 ($73.60)
Sewerage: $191,000 ($8.13)
Highways: $134,000 ($5.70)
Other: $9,000 ($0.38)
- Tax - Property: $4,573,000 ($194.55)
Public Utilities Sales: $2,261,000 ($96.19)
Occupation and Business License - Other: $1,077,000 ($45.82)
Other Selective Sales: $641,000 ($27.27)
Other License: $302,000 ($12.85)
Insurance Premiums Sales: $278,000 ($11.83)
Documentary and Stock Transfer: $7,000 ($0.30)
Edgewater government finances - Debt in 2017 (per resident):
- Long Term Debt - Beginning Outstanding - Unspecified Public Purpose: $21,453,000 ($912.66)
Outstanding Unspecified Public Purpose: $19,422,000 ($826.26)
Retired Unspecified Public Purpose: $919,000 ($39.10)
Edgewater government finances - Cash and Securities in 2017 (per resident):
- Other Funds - Cash and Securities: $11,912,000 ($506.76)
- Sinking Funds - Cash and Securities: $4,000 ($0.17)
9.11% of this county's 2021 resident taxpayers lived in other counties in 2020 ($71,399 average adjusted gross income)
| Here: | 9.11% |
| Florida average: | 8.80% |
0.04% of residents moved from foreign countries ($209 average AGI)
Volusia County: 0.04% Florida average: 0.05%
Top counties from which taxpayers relocated into this county between 2020 and 2021:
| from Seminole County, FL | |
| from Orange County, FL | |
| from Flagler County, FL |
6.49% of this county's 2020 resident taxpayers moved to other counties in 2021 ($53,189 average adjusted gross income)
| Here: | 6.49% |
| Florida average: | 7.45% |
0.03% of residents moved to foreign countries ($332 average AGI)
Volusia County: 0.03% Florida average: 0.04%
Top counties to which taxpayers relocated from this county between 2020 and 2021:
| to Seminole County, FL | |
| to Orange County, FL | |
| to Flagler County, FL |
| Businesses in Edgewater, FL | ||||
| Name | Count | Name | Count | |
|---|---|---|---|---|
| 7-Eleven | 1 | Dunkin Donuts | 1 | |
| AT&T | 1 | FedEx | 3 | |
| Advance Auto Parts | 1 | Goodwill | 1 | |
| AutoZone | 1 | H&R Block | 1 | |
| Best Western | 1 | Penske | 1 | |
| Blockbuster | 1 | Publix Super Markets | 1 | |
| Burger King | 1 | U-Haul | 1 | |
| CVS | 1 | UPS | 5 | |
| Chick-Fil-A | 1 | YMCA | 1 | |
| Domino's Pizza | 1 | |||
Strongest AM radio stations in Edgewater:
- WIXC (1060 AM; 50 kW; TITUSVILLE, FL; Owner: GENESIS COMMUNICATIONS I, INC.)
- WONQ (1030 AM; 45 kW; OVIEDO, FL; Owner: FLORIDA BROADCASTERS)
- WSBB (1230 AM; 1 kW; NEW SMYRNA BEACH, FL; Owner: T K RADIO, INC.)
- WDYZ (990 AM; 50 kW; ORLANDO, FL; Owner: ABC, INC.)
- WQTM (740 AM; 50 kW; ORLANDO, FL; Owner: CLEAR CHANNEL BROADCASTING LICENSES, INC.)
- WFLF (540 AM; 50 kW; PINE HILLS, FL; Owner: CLEAR CHANNEL BROADCASTING LICENSES, INC.)
- WHOO (1080 AM; daytime; 35 kW; KISSIMMEE, FL; Owner: GENESIS COMMUNICATIONS I, INC.)
- WYND (1310 AM; 8 kW; DELAND, FL; Owner: BUDDY TUCKER ASSOCIATION, INC.)
- WORL (660 AM; 5 kW; ALTAMONTE SPRINGS, FL; Owner: JAMES CRYSTAL ORLANDO, INC.)
- WELE (1380 AM; 5 kW; ORMOND BEACH, FL; Owner: WINGS COMMUNICATIONS, INCORPORATED)
- WTLN (950 AM; 12 kW; ORLANDO, FL; Owner: TM2, INC.)
- WOKV (690 AM; 50 kW; JACKSONVILLE, FL; Owner: COX RADIO, INC.)
- WDBO (580 AM; 5 kW; ORLANDO, FL; Owner: COX RADIO, INC.)
Strongest FM radio stations in Edgewater:
- WKRO-FM (93.1 FM; EDGEWATER, FL; Owner: BLACK CROW RADIO, LLC)
- WJLU (89.7 FM; NEW SMYRNA BEACH, FL; Owner: CORNERSTONE BROADCASTING CORPORATION)
- WNUE-FM (98.1 FM; TITUSVILLE, FL; Owner: MEGA COMMUNICATIONS OF DAYTONA BEACH LICENSEE, LLC)
- WJHM (101.9 FM; DAYTONA BEACH, FL; Owner: INFINITY RADIO OPERATIONS INC.)
- WOCL (105.9 FM; DELAND, FL; Owner: INFINITY RADIO OPERATIONS INC.)
- WMGF (107.7 FM; MOUNT DORA, FL; Owner: CLEAR CHANNEL BROADCASTING LICENSES, INC.)
- WOMX-FM (105.1 FM; ORLANDO, FL; Owner: INFINITY RADIO OPERATIONS INC.)
- WJRR (101.1 FM; COCOA BEACH, FL; Owner: CLEAR CHANNEL BROADCASTING LICENSES, INC.)
- WSHE (100.3 FM; ORLANDO, FL; Owner: CLEAR CHANNEL BROADCASTING LICENSES, INC.)
- WTKS-FM (104.1 FM; COCOA BEACH, FL; Owner: CLEAR CHANNEL BROADCASTING LICENSES, INC.)
- WHTQ (96.5 FM; ORLANDO, FL; Owner: COX RADIO, INC.)
- WWKA (92.3 FM; ORLANDO, FL; Owner: COX RADIO, INC.)
- WPOZ (88.3 FM; UNION PARK, FL; Owner: CENTRAL FLORIDA EDUCATIONAL FOUNDATION, INC.)
- WCFB (94.5 FM; DAYTONA BEACH, FL; Owner: COX RADIO, INC.)
- WKTO (88.7 FM; EDGEWATER, FL; Owner: MIMS COMMUNITY RADIO, INC.)
- WMFE-FM (90.7 FM; ORLANDO, FL; Owner: COMMUNITY COMMUNICATIONS, INC.)
- WXXL (106.7 FM; TAVARES, FL; Owner: AMFM RADIO LICENSES, L.L.C.)
- WGNE-FM (99.9 FM; PALATKA, FL; Owner: RENDA BROADCASTING CORP. OF NEVADA)
- WHOG-FM (95.7 FM; ORMOND-BY-THE-SEA, FL; Owner: BLACK CROW RADIO, LLC)
- WVYB (103.3 FM; HOLLY HILL, FL; Owner: BLACK CROW MEDIA, LLC)
TV broadcast stations around Edgewater:
- WESH (Channel 2; DAYTONA BEACH, FL; Owner: ORLANDO HEARST-ARGYLE TELEVISION, INC.)
- WCEU (Channel 15; NEW SMYRNA BEACH, FL; Owner: DAYTONA BEACH COMMUNITY COLLEGE)
- WFTV (Channel 9; ORLANDO, FL; Owner: WFTV-TV HOLDINGS, INC.)
- WRBW (Channel 65; ORLANDO, FL; Owner: FOX TELEVISION STATIONS, INC.)
- WXXU-LP (Channel 12; ALTAMONTE SPRINGS, FL; Owner: RAMA COMMUNICATIONS)
- WKMG-TV (Channel 6; ORLANDO, FL; Owner: POST-NEWSWEEK STATIONS ORLANDO, INC.)
- WVEN-TV (Channel 26; DAYTONA BEACH, FL; Owner: ENTRAVISION HOLDINGS, LLC)
- WACX (Channel 55; LEESBURG, FL; Owner: ASSOCIATED CHRISTIAN TELEVISION SYSTEM, INC.)
- WKCF (Channel 18; CLERMONT, FL; Owner: EMMIS TELEVISION LICENSE CORPORATION)
- WLCB-TV (Channel 45; LEESBURG, FL; Owner: GOOD LIFE BROADCASTING, INC.)
- WOFL (Channel 35; ORLANDO, FL; Owner: FOX TELEVISION STATIONS, INC.)
- WZXZ-CA (Channel 11; ORLANDO, ETC., FL; Owner: THE BOX WORLDWIDE LLC)
- WMFE-TV (Channel 24; ORLANDO, FL; Owner: COMMUNITY COMMUNICATIONS, INC.)
- WRDQ (Channel 27; ORLANDO, FL; Owner: WFTV-TV HOLDINGS, INC.)
- WTGL-TV (Channel 52; COCOA, FL; Owner: GOOD LIFE BROADCASTING, INC.)
- WBCC (Channel 68; COCOA, FL; Owner: BREVARD COMMUNITY COLLEGE)
- WFOR-TV (Channel 4; MIAMI, FL; Owner: CBS TELEVISION STATIONS INC.)
- WPXB-LP (Channel 57; DAYTONA BEACH, FL; Owner: PAXSON COMMUNICATIONS LPTV, INC.)
- WDYB-LP (Channel 53; DAYTONA BEACH, FL; Owner: TIGER EYE BROADCASTING CORPORATION)
- National Bridge Inventory (NBI) Statistics
- 9Number of bridges
- 43ft / 13.0mTotal length
- 90,952Total average daily traffic
- 14,372Total average daily truck traffic
FCC Registered Broadcast Land Mobile Towers: 9 (See the full list of FCC Registered Broadcast Land Mobile Towers in Edgewater, FL)
FCC Registered Microwave Towers: 7 (See the full list of FCC Registered Microwave Towers in this town)
FCC Registered Paging Towers: 1 (See the full list of FCC Registered Paging Towers)
FCC Registered Maritime Coast & Aviation Ground Towers: 1 (See the full list of FCC Registered Maritime Coast & Aviation Ground Towers)
FCC Registered Amateur Radio Licenses: 202 (See the full list of FCC Registered Amateur Radio Licenses in Edgewater)
FAA Registered Aircraft Manufacturers and Dealers: 7 (See the full list of FAA Registered Manufacturers and Dealers in Edgewater)
FAA Registered Aircraft: 78 (See the full list of FAA Registered Aircraft)
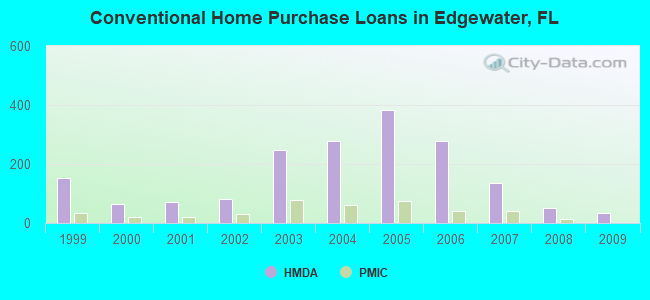
| Home Mortgage Disclosure Act Aggregated Statistics For Year 2009 (Based on 3 partial tracts) | ||||||||||||||
| A) FHA, FSA/RHS & VA Home Purchase Loans | B) Conventional Home Purchase Loans | C) Refinancings | D) Home Improvement Loans | E) Loans on Dwellings For 5+ Families | F) Non-occupant Loans on < 5 Family Dwellings (A B C & D) | G) Loans On Manufactured Home Dwelling (A B C & D) | ||||||||
|---|---|---|---|---|---|---|---|---|---|---|---|---|---|---|
| Number | Average Value | Number | Average Value | Number | Average Value | Number | Average Value | Number | Average Value | Number | Average Value | Number | Average Value | |
| LOANS ORIGINATED | 35 | $117,153 | 34 | $97,109 | 80 | $130,937 | 5 | $49,786 | 1 | $106,120 | 23 | $107,326 | 7 | $78,799 |
| APPLICATIONS APPROVED, NOT ACCEPTED | 4 | $104,490 | 4 | $126,145 | 16 | $161,123 | 0 | $0 | 0 | $0 | 4 | $139,605 | 3 | $110,553 |
| APPLICATIONS DENIED | 18 | $119,064 | 12 | $114,572 | 65 | $159,383 | 7 | $50,580 | 0 | $0 | 8 | $113,538 | 5 | $94,214 |
| APPLICATIONS WITHDRAWN | 4 | $124,395 | 6 | $85,457 | 40 | $135,117 | 2 | $52,805 | 0 | $0 | 3 | $111,400 | 6 | $96,365 |
| FILES CLOSED FOR INCOMPLETENESS | 1 | $130,670 | 0 | $0 | 14 | $159,559 | 1 | $212,630 | 0 | $0 | 0 | $0 | 0 | $0 |
Detailed HMDA statistics for the following Tracts: 0830.01 , 0830.04, 0830.05
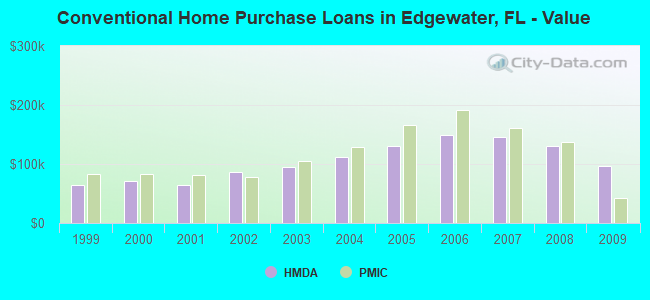
| Private Mortgage Insurance Companies Aggregated Statistics For Year 2009 (Based on 2 partial tracts) | ||||
| A) Conventional Home Purchase Loans | B) Refinancings | |||
|---|---|---|---|---|
| Number | Average Value | Number | Average Value | |
| LOANS ORIGINATED | 1 | $42,990 | 0 | $0 |
| APPLICATIONS APPROVED, NOT ACCEPTED | 1 | $218,300 | 1 | $46,090 |
| APPLICATIONS DENIED | 0 | $0 | 0 | $0 |
| APPLICATIONS WITHDRAWN | 0 | $0 | 0 | $0 |
| FILES CLOSED FOR INCOMPLETENESS | 0 | $0 | 0 | $0 |
Detailed PMIC statistics for the following Tracts: 0830.01 , 0830.04, 0830.05
2003 - 2018 National Fire Incident Reporting System (NFIRS) incidents
- Fire incident types reported to NFIRS in Edgewater, FL
- 57645.9%Outside Fires
- 39231.3%Structure Fires
- 18714.9%Mobile Property/Vehicle Fires
- 997.9%Other
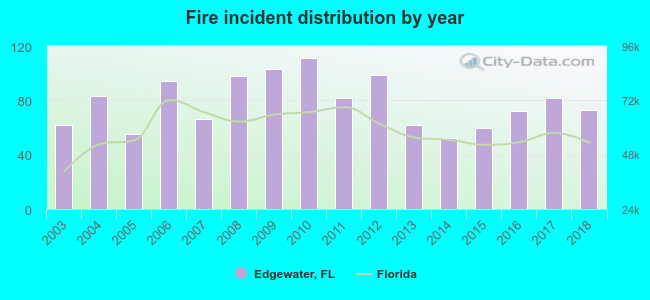 According to the data from the years 2003 - 2018 the average number of fire incidents per year is 78. The highest number of reported fires - 111 took place in 2010, and the least - 52 in 2014. The data has a growing trend.
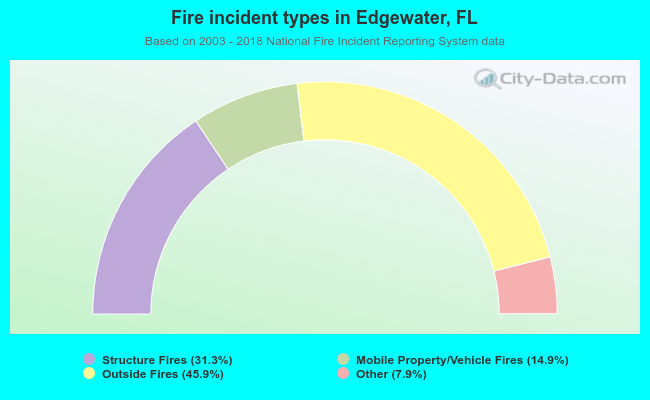 When looking into fire subcategories, the most reports belonged to: Outside Fires (45.9%), and Structure Fires (31.3%).
Fire-safe hotels and motels in Edgewater, Florida:
- Carter's Motel, 2450 S Ridgewood Ave, Edgewater, Florida 32141 , Phone: (386) 428-8916, Fax: (386) 428-8916
- Best Western Edgewater Inn, 1730 S Ridgewood Ave, Edgewater, Florida 32132 , Phone: (386) 427-7101
| Most common first names in Edgewater, FL among deceased individuals | ||
| Name | Count | Lived (average) |
|---|---|---|
| John | 134 | 75.6 years |
| William | 118 | 75.2 years |
| Robert | 111 | 75.2 years |
| James | 100 | 75.5 years |
| Charles | 88 | 77.7 years |
| Mary | 80 | 79.8 years |
| George | 75 | 77.3 years |
| Joseph | 71 | 75.9 years |
| Donald | 60 | 72.4 years |
| Helen | 59 | 82.0 years |
| Most common last names in Edgewater, FL among deceased individuals | ||
| Last name | Count | Lived (average) |
|---|---|---|
| Smith | 30 | 76.5 years |
| Jones | 29 | 75.5 years |
| Johnson | 25 | 73.3 years |
| Miller | 22 | 73.8 years |
| Davis | 21 | 78.8 years |
| Brown | 20 | 79.3 years |
| Williams | 16 | 79.9 years |
| Martin | 15 | 74.4 years |
| Baker | 15 | 82.0 years |
| Robinson | 14 | 72.0 years |
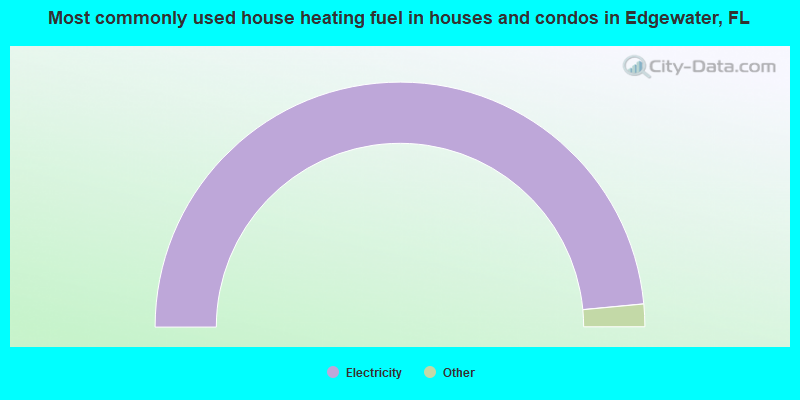
- 97.0%Electricity
- 1.8%Utility gas
- 0.5%Bottled, tank, or LP gas
- 0.3%No fuel used
- 0.3%Solar energy
- 0.1%Fuel oil, kerosene, etc.
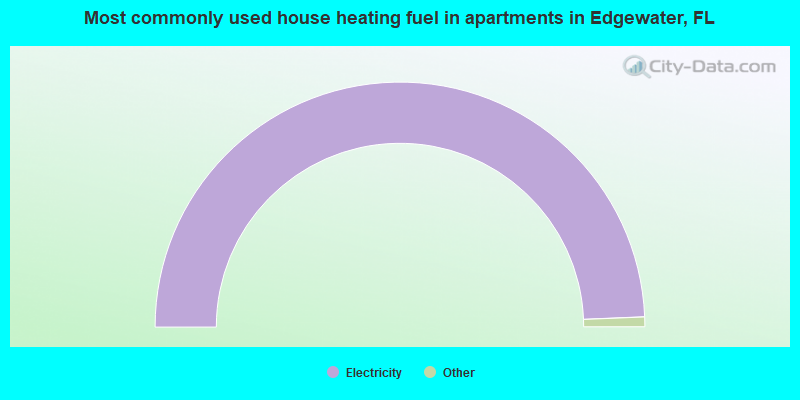
- 98.8%Electricity
- 0.6%Utility gas
- 0.6%No fuel used
Edgewater compared to Florida state average:
- Unemployed percentage significantly below state average.
- Black race population percentage significantly below state average.
- Hispanic race population percentage significantly below state average.
- Median age above state average.
- Foreign-born population percentage significantly below state average.
- Renting percentage below state average.
- Length of stay since moving in significantly above state average.
Edgewater on our top lists:
- #40 on the list of "Top 101 cities with the most people taking a motorcycle to work (population 5,000+)"
- #40 on the list of "Top 101 counties with the lowest number of births per 1000 residents 2007-2013"
- #40 on the list of "Top 101 counties with the highest ground withdrawal of fresh water for public supply"
- #50 on the list of "Top 101 counties with the highest number of deaths per 1000 residents 2007-2013 (pop. 50,000+)"
- #69 on the list of "Top 101 counties with the lowest Particulate Matter (PM2.5) Annual air pollution readings in 2012 (µg/m3)"
- #75 on the list of "Top 101 counties with the lowest Ozone (1-hour) air pollution readings in 2012 (ppm)"

|
|
Total of 35 patent applications in 2008-2024.