El Cerrito: Fire Incidents, California (CA)
Where are fire incidents reported in El Cerrito, CA
Something went wrong! Please refresh the page.
| Fire incidents reported | |
|---|---|
| Sreet name | Count |
| SAN PABLO AVE | 362 |
| CUTTING BLVD | 78 |
| LIBERTY ST | 64 |
| LEXINGTON AVE | 62 |
| EL CERRITO PLZ | 46 |
| ARLINGTON BLVD | 30 |
| ASHBURY AVE | 30 |
| MOESER LN | 30 |
| CENTRAL AVE | 26 |
| MANILA AVE | 26 |
| NORVELL ST | 26 |
| KEARNEY ST | 24 |
| ELM ST | 22 |
| KEY BLVD | 22 |
| NAVELLIER ST | 22 |
| POTRERO AVE | 22 |
| SEAVIEW DR | 22 |
| FAIRMOUNT AVE | 18 |
| SCHMIDT LN | 18 |
| TERRACE DR | 18 |
| EVERETT ST | 16 |
| RICHMOND ST | 16 |
| STOCKTON AVE | 14 |
| TAMALPAIS AVE | 14 |
| GLADYS AVE | 12 |
| KING CT | 12 |
| KING DR | 12 |
| CARLSON BLVD | 10 |
| JUNCTION AVE | 10 |
| PORTOLA DR | 10 |
2005 - 2018 National Fire Incident Reporting System (NFIRS) incidents
- Incident types reported to NFIRS in El Cerrito, CA
- 4,78451.7%Rescue & EMS
- 1,47816.0%Good Intent Call
- 8309.0%Service Call
- 7878.5%Fire
- 6857.4%Hazardous Condition
- 6647.2%False Alarm
- 100.1%Special Incident
- Fire incident types reported to NFIRS in El Cerrito, CA
- 40751.7%Structure Fires
- 23730.1%Outside Fires
- 10112.8%Mobile Property/Vehicle Fires
- 425.3%Other
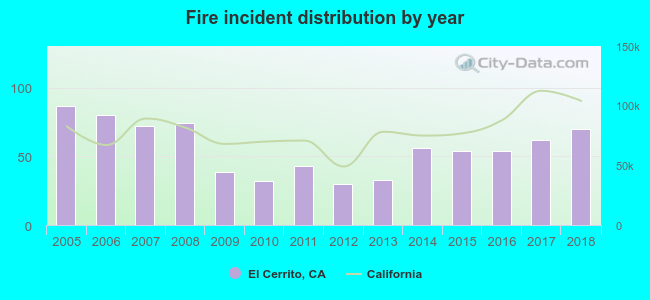 According to the data from the years 2005 - 2018 the average number of fires per year is 56. The highest number of reported fires - 87 took place in 2005, and the least - 30 in 2012. The data has a decreasing trend.
The average number of yearly fire incidents per 10k residents in El Cerrito, CA compared to nearest cities:
(Note: Based on data for the last 3 years, including only cities with population 5,000 and above)
| El Cerrito: | 25.2 |
| Kensington: | 11.2 |
| Albany: | 19.3 |
| Richmond: | 41.0 |
| Berkeley: | 22.9 |
| El Sobrante: | 14.5 |
| San Pablo: | 41.0 |
| Briones: | 1.5 |
| Pinole: | 18.5 |
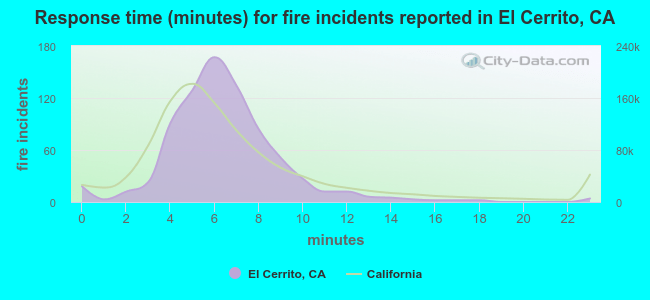 The median response time based on all reported fire incidents is 6 minutes. This is about the same as the state median value.
The median response time in El Cerrito, CA compared to nearest cities:
(Note: Based on data for all years, including only cities with at least 500 fire incidents)
| El Cerrito: | 6 minutes |
| Albany: | 4 minutes |
| Richmond: | 7 minutes |
| Berkeley: | 5 minutes |
| San Pablo: | 7 minutes |
| Hercules: | 6 minutes |
| Rodeo: | 6 minutes |
| Oakland: | 5 minutes |
| Lafayette: | 7 minutes |
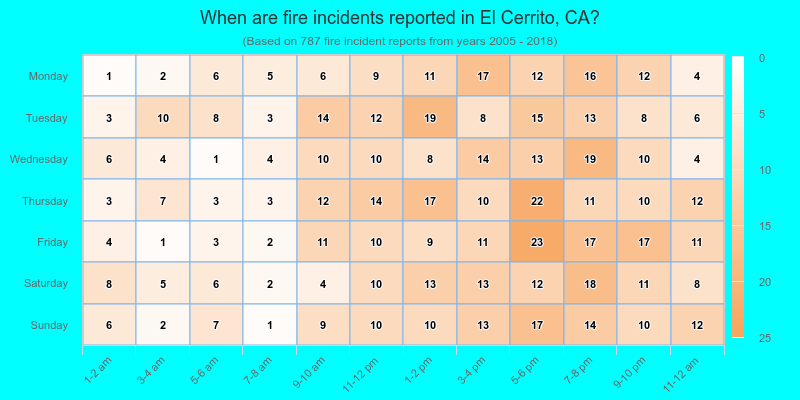
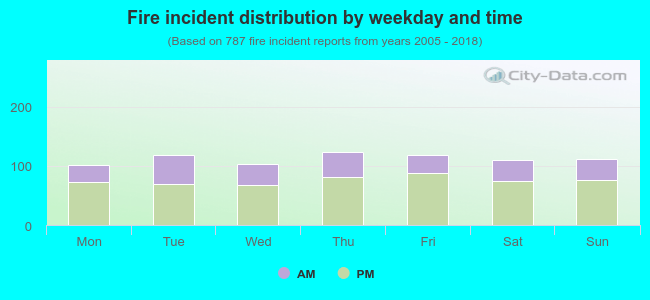 32.7% incidents where reported in the morning and 67.3% in the evening. The most fires (15.8%) took place on Thursday, and the least (12.8%) on Monday.
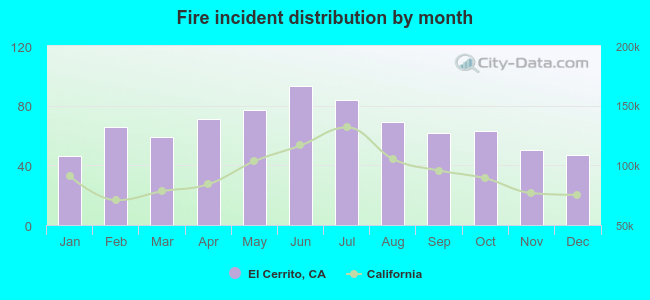 According to the 787 fires from years 2005 - 2018 most fires (11.8%) took place during June, and the least (5.8%) in January.
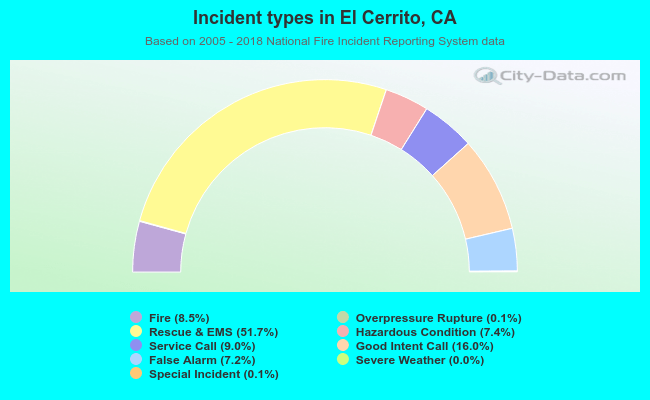 Out of all 9,247 cases reported during the years 2005 - 2018, the most belonged to the categories: Rescue & EMS (51.7%), Good Intent Call (16.0%), and Service Call (9.0%).
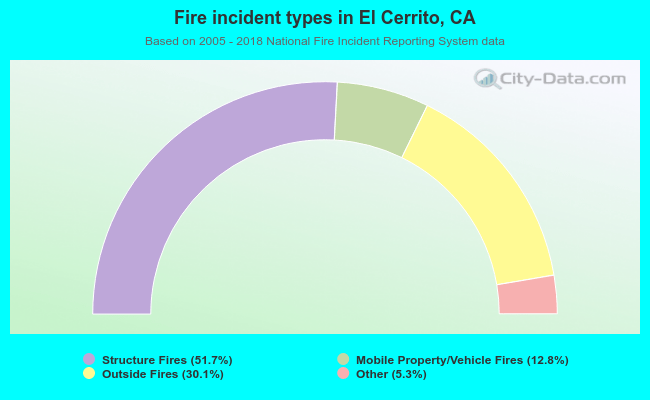 When looking into fire subcategories, the most incidents belonged to: Structure Fires (51.7%), and Outside Fires (30.1%).