Exeter: Fire Incidents, Pennsylvania (PA)
Where are fire incidents reported in Exeter, PA
Something went wrong! Please refresh the page.
|
| |||||||||||||||||||||||||||||||||||||||||||||||||||||||||||||||||||||||||||||||||||||||||||||||||||||||||||||
2008 - 2018 National Fire Incident Reporting System (NFIRS) incidents
- Incident types reported to NFIRS in Exeter, PA
- 66156.6%Rescue & EMS
- 14412.3%Good Intent Call
- 13211.3%Fire
- 1139.7%False Alarm
- 524.5%Hazardous Condition
- 504.3%Service Call
- 80.7%Special Incident
- 50.4%Severe Weather
- 30.3%Overpressure Rupture
- Fire incident types reported to NFIRS in Exeter, PA
- 8765.9%Structure Fires
- 2115.9%Outside Fires
- 1914.4%Other
- 53.8%Mobile Property/Vehicle Fires
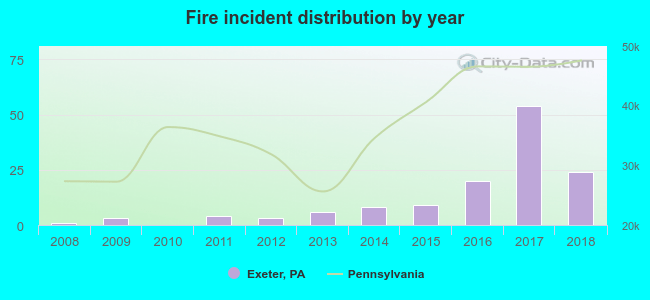 Based on the data from the years 2008 - 2018 the average number of fire incidents per year is 12. The highest number of fire incidents - 54 took place in 2017, and the least - 0 in 2010. The data has a growing trend.
The average number of yearly fire incidents per 10k residents in Exeter, PA compared to nearest cities:
(Note: Based on data for the last 3 years, including only cities with population 5,000 and above)
| Exeter: | 58.3 |
| Pittston: | 52.9 |
| Swoyersville: | 4.7 |
| Old Forge: | 33.3 |
| Kingston: | 57.5 |
| Moosic: | 42.2 |
| Taylor: | 4.9 |
| Plymouth: | 23.3 |
| Scranton: | 21.6 |

 39.4% incidents where reported in the morning and 60.6% in the evening. The most fires (19.7%) took place on Monday, and the least (7.6%) on Wednesday.
 According to the 132 fire incidents from years 2008 - 2018 most fires (12.1%) took place during February, and the least (0.8%) in June.
 Out of all 1,168 cases reported during the years 2008 - 2018, the most belonged to the categories: Rescue & EMS (56.6%), Good Intent Call (12.3%), and Fire (11.3%).
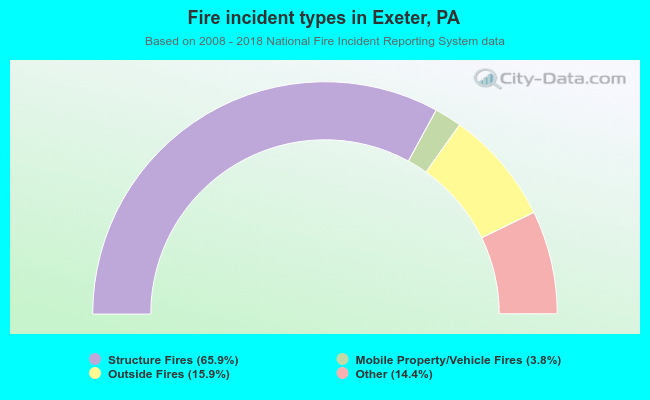 When looking into fire subcategories, the most reports belonged to: Structure Fires (65.9%), and Outside Fires (15.9%).