Fairfield: Fire Incidents, Alabama (AL)
Where are fire incidents reported in Fairfield, AL
Something went wrong! Please refresh the page.
|
| |||||||||||||||||||||||||||||||||||||||||||||||||||||||||||||||||||||||||||||||||||||||||||||||||||||||||||||
2003 - 2018 National Fire Incident Reporting System (NFIRS) incidents
- Incident types reported to NFIRS in Fairfield, AL
- 1,26268.5%Rescue & EMS
- 25413.8%Fire
- 1447.8%False Alarm
- 754.1%Service Call
- 593.2%Hazardous Condition
- 472.6%Good Intent Call
- Fire incident types reported to NFIRS in Fairfield, AL
- 11244.1%Structure Fires
- 7730.3%Outside Fires
- 4417.3%Mobile Property/Vehicle Fires
- 218.3%Other
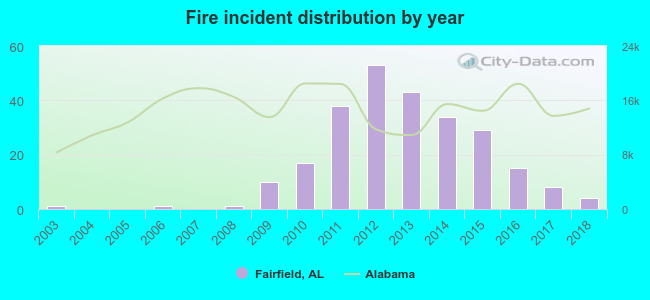 Based on the data from the years 2003 - 2018 the average number of fire incidents per year is 16. The highest number of reported fires - 53 took place in 2012, and the least - 0 in 2004. The data has a growing trend.
The average number of yearly fire incidents per 10k residents in Fairfield, AL compared to nearest cities:
(Note: Based on data for the last 3 years, including only cities with population 5,000 and above)
| Fairfield: | 8.2 |
| Midfield: | 63.3 |
| Pleasant Grove: | 30.3 |
| Hueytown: | 27.8 |
| Homewood: | 35.3 |
| Bessemer: | 92.8 |
| Birmingham: | 87.0 |
| Vestavia Hills: | 20.2 |
| Hoover: | 8.0 |

 34.6% incidents where reported in the morning and 65.4% in the evening. The most fires (16.5%) took place on Sunday, and the least (12.2%) on Friday.
 According to the 254 incident reports from years 2003 - 2018 most fires (11.4%) took place during March, and the least (4.7%) in April.
 Out of all 1,843 cases reported during the years 2003 - 2018, the most belonged to the categories: Rescue & EMS (68.5%), Fire (13.8%), and False Alarm (7.8%).
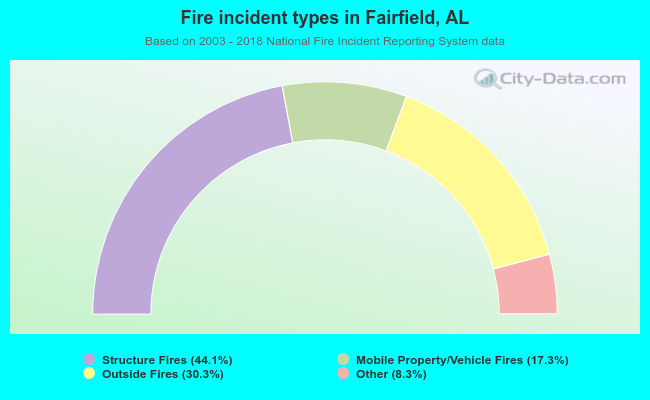 When looking into fire subcategories, the most incidents belonged to: Structure Fires (44.1%), and Outside Fires (30.3%).