Garfield Heights: Fire Incidents, Ohio (OH)
Where are fire incidents reported in Garfield Heights, OH
Something went wrong! Please refresh the page.
| Fire incidents reported | |
|---|---|
| Sreet name | Count |
| TURNEY RD. | 120 |
| I-480 | 100 |
| TURNEY RD | 80 |
| EAST 131 ST. | 60 |
| BROADWAY AVE. | 58 |
| GRANGER RD. | 56 |
| ROCKSIDE RD. | 56 |
| MCCRACKEN RD. | 48 |
| TRANSPORTATION BLVD | 44 |
| BROADWAY AVE | 42 |
| GRANGER RD | 42 |
| WARNER RD | 34 |
| EAST 131 ST | 32 |
| I480 | 32 |
| MAPLEROW AVE. | 32 |
| PARK HEIGHTS AVE. | 32 |
| TRANSPORTATION BLVD. | 32 |
| DRESSLER RD. | 30 |
| EAST 88 ST. | 30 |
| OSBORN RD. | 30 |
| MAPLE LEAF DR. | 26 |
| MCCRACKEN RD | 26 |
| VALLEY LN. | 26 |
| WARNER RD. | 26 |
| CRANWOOD PARK BLVD. | 20 |
| HENRY ST. | 20 |
| THORNHURST AVE | 20 |
| EAST 126 ST | 18 |
| GARFIELD BLVD. | 18 |
| SOUTH PARKWAY DR. | 18 |
| Other | 276 |
2002 - 2018 National Fire Incident Reporting System (NFIRS) incidents
- Incident types reported to NFIRS in Garfield Heights, OH
- 5,21340.9%Rescue & EMS
- 3,17424.9%Hazardous Condition
- 1,48411.6%Fire
- 1,0998.6%Service Call
- 1,0087.9%False Alarm
- 6224.9%Good Intent Call
- 760.6%Special Incident
- 630.5%Overpressure Rupture
- Fire incident types reported to NFIRS in Garfield Heights, OH
- 69747.0%Structure Fires
- 40627.4%Outside Fires
- 37024.9%Mobile Property/Vehicle Fires
- 110.7%Other
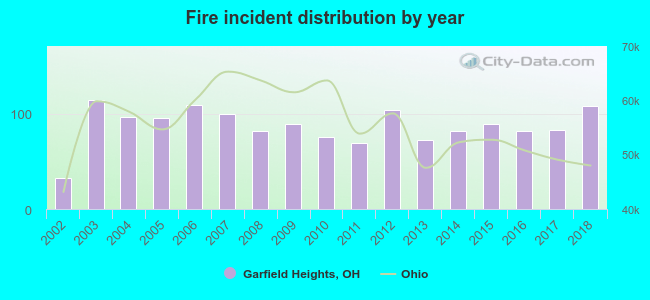 According to the data from the years 2002 - 2018 the average number of fires per year is 87. The highest number of reported fires - 114 took place in 2003, and the least - 33 in 2002. The data has a growing trend.
The average number of yearly fire incidents per 10k residents in Garfield Heights, OH compared to nearest cities:
(Note: Based on data for the last 3 years, including only cities with population 5,000 and above)
| Garfield Heights: | 32.2 |
| Maple Heights: | 15.1 |
| Independence: | 55.6 |
| Bedford: | 51.5 |
| Warrensville Heights: | 5.3 |
| Seven Hills: | 23.6 |
| Shaker Heights: | 34.3 |
| Bedford Heights: | 28.7 |
| Cleveland: | 6.9 |
 The median response time based on all reported fire incidents is 4 minutes. This is lower compared to the Ohio median value.
The median response time in Garfield Heights, OH compared to nearest cities:
(Note: Based on data for all years, including only cities with at least 500 fire incidents)
| Garfield Heights: | 4 minutes |
| Independence: | 6 minutes |
| Bedford: | 4 minutes |
| Shaker Heights: | 4 minutes |
| Cleveland: | 5 minutes |
| University Heights: | 5 minutes |
| Cleveland Heights: | 5 minutes |
| Beachwood: | 4 minutes |
| Parma: | 4 minutes |
 Based on the reports from the years 2002 - 2018 the average number of fire-related yearly casualties is 1. The highest number of reported injuries - 5 took place in 2002, and the lowest - 0 in 2003. The data has a declining trend.
The average number of injuries per 1,000 fires is 21. This indicator was the highest - 152 in 2002, and the lowest 0 in 2003. The trend for injuries per 1,000 incidents is decreasing. Compared to the Ohio value the number of injuries per 1,000 incidents is about the same.
Based on the reports from the years 2002 - 2018 the average number of fire-related yearly casualties is 1. The highest number of reported injuries - 5 took place in 2002, and the lowest - 0 in 2003. The data has a declining trend.
The average number of injuries per 1,000 fires is 21. This indicator was the highest - 152 in 2002, and the lowest 0 in 2003. The trend for injuries per 1,000 incidents is decreasing. Compared to the Ohio value the number of injuries per 1,000 incidents is about the same.Casualties per 1,000 incidents in Garfield Heights, OH compared to nearest cities:
(Note: Based on data for all years, including only cities with at least 500 fire incidents)
| Garfield Heights: | 16.2 |
| Independence: | 8.2 |
| Bedford: | 17.1 |
| Shaker Heights: | 49.0 |
| Cleveland: | 17.3 |
| University Heights: | 17.9 |
| Cleveland Heights: | 16.1 |
| Beachwood: | 2.9 |
| Parma: | 19.1 |
 33.0% incidents where reported in the morning and 67.0% in the evening. The most fires (15.3%) took place on Saturday, and the least (11.9%) on Wednesday.
 According to the 1,484 fires from years 2002 - 2018 most fires (10.9%) took place during May, and the least (5.7%) in January.
 Out of all 12,744 cases reported during the years 2002 - 2018, the most belonged to the categories: Rescue & EMS (40.9%), Hazardous Condition (24.9%), and Fire (11.6%).
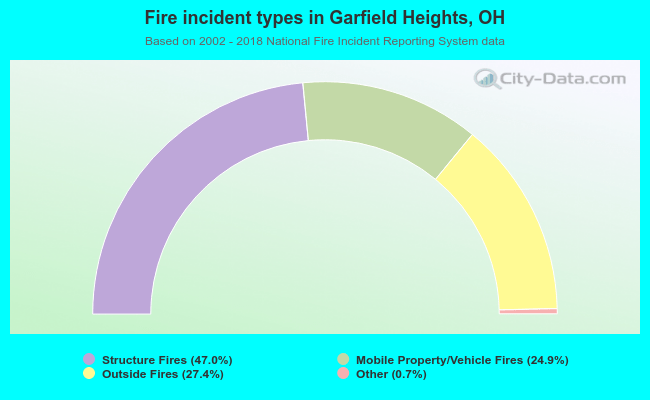 When looking into fire subcategories, the most incidents belonged to: Structure Fires (47.0%), and Outside Fires (27.4%).