Parma: Fire Incidents, Ohio (OH)
Where are fire incidents reported in Parma, OH
Something went wrong! Please refresh the page.
| Fire incidents reported | |
|---|---|
| Sreet name | Count |
| RIDGE RD | 344 |
| BROADVIEW RD | 328 |
| STATE RD | 282 |
| SNOW RD | 228 |
| PLEASANT VALLEY RD | 204 |
| RIDGEWOOD DR | 132 |
| DAY DR | 124 |
| CHEVROLET BLVD | 94 |
| BROOKPARK RD | 82 |
| PEARL RD | 76 |
| SPRAGUE RD | 62 |
| AMES RD | 50 |
| 130TH ST | 48 |
| KNOLLWOOD DR | 48 |
| LAURENT DR | 48 |
| STUMPH RD | 46 |
| 54TH ST | 44 |
| LOYA DR | 42 |
| FORTUNE AVE | 38 |
| YORK RD | 38 |
| POWERS BLVD | 36 |
| GRANTWOOD DR | 34 |
| HAUSERMAN RD | 30 |
| THEOTA AVE | 30 |
| TUXEDO AVE | 30 |
| PARK BLVD | 28 |
| PELHAM DR | 26 |
| HUFFMAN RD | 24 |
| WALTER AVE | 24 |
| 24TH ST | 22 |
| Other | 34 |
2003 - 2018 National Fire Incident Reporting System (NFIRS) incidents
- Incident types reported to NFIRS in Parma, OH
- 42,01172.3%Rescue & EMS
- 6,44011.1%Hazardous Condition
- 3,0455.2%Service Call
- 2,6764.6%Fire
- 2,5514.4%False Alarm
- 1,2592.2%Good Intent Call
- 740.1%Special Incident
- Fire incident types reported to NFIRS in Parma, OH
- 1,26247.2%Structure Fires
- 1,04238.9%Outside Fires
- 33712.6%Mobile Property/Vehicle Fires
- 351.3%Other
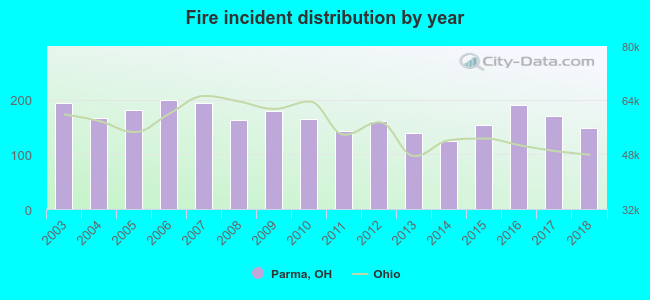 Based on the data from the years 2003 - 2018 the average number of fire incidents per year is 167. The highest number of reported fires - 199 took place in 2006, and the least - 124 in 2014. The data has a dropping trend.
The average number of yearly fire incidents per 10k residents in Parma, OH compared to nearest cities:
(Note: Based on data for the last 3 years, including only cities with population 5,000 and above)
| Parma: | 21.2 |
| Parma Heights: | 23.9 |
| Seven Hills: | 23.6 |
| Brooklyn: | 42.3 |
| Middleburg Heights: | 26.2 |
| Independence: | 55.6 |
| Brook Park: | 25.1 |
| North Royalton: | 19.5 |
| Broadview Heights: | 15.9 |
 The median response time based on all reported fire incidents is 4 minutes. This is lower compared to the Ohio median value.
The median response time in Parma, OH compared to nearest cities:
(Note: Based on data for all years, including only cities with at least 500 fire incidents)
| Parma: | 4 minutes |
| Parma Heights: | 3 minutes |
| Brooklyn: | 4 minutes |
| Independence: | 6 minutes |
| Brook Park: | 5 minutes |
| North Royalton: | 5 minutes |
| Garfield Heights: | 4 minutes |
| Cleveland: | 5 minutes |
| Berea: | 5 minutes |
 Based on the reports from the years 2003 - 2018 the average number of fire-related yearly casualties is 3. The highest number of reported casualties - 9 took place in 2003, and the lowest - 0 in 2012. The data has a dropping trend.
The average number of injuries per 1,000 fire incidents is 19. This indicator was the highest - 46 in 2003, and the lowest 0 in 2012. The trend for injuries per 1,000 incidents is decreasing. Compared to the Ohio value the number of casualties per 1,000 incidents is higher.
Based on the reports from the years 2003 - 2018 the average number of fire-related yearly casualties is 3. The highest number of reported casualties - 9 took place in 2003, and the lowest - 0 in 2012. The data has a dropping trend.
The average number of injuries per 1,000 fire incidents is 19. This indicator was the highest - 46 in 2003, and the lowest 0 in 2012. The trend for injuries per 1,000 incidents is decreasing. Compared to the Ohio value the number of casualties per 1,000 incidents is higher.Casualties per 1,000 incidents in Parma, OH compared to nearest cities:
(Note: Based on data for all years, including only cities with at least 500 fire incidents)
| Parma: | 19.1 |
| Parma Heights: | 43.3 |
| Brooklyn: | 6.3 |
| Independence: | 8.2 |
| Brook Park: | 25.0 |
| North Royalton: | 11.0 |
| Garfield Heights: | 16.2 |
| Cleveland: | 17.3 |
| Berea: | 15.4 |
 26.5% incidents where reported in the morning and 73.5% in the evening. The most fires (15.9%) took place on Saturday, and the least (13.1%) on Tuesday.
 According to the 2,676 reports from years 2003 - 2018 most fires (11.9%) took place during July, and the least (5.6%) in February.
 Out of all 58,138 cases reported during the years 2003 - 2018, the most belonged to the categories: Rescue & EMS (72.3%), Hazardous Condition (11.1%), and Service Call (5.2%).
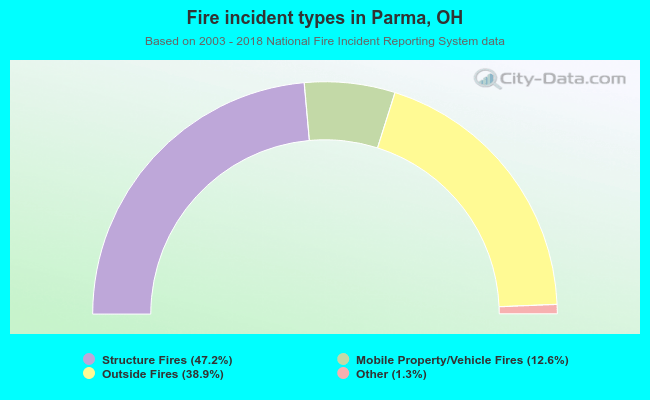 When looking into fire subcategories, the most incidents belonged to: Structure Fires (47.2%), and Outside Fires (38.9%).