Brook Park: Fire Incidents, Ohio (OH)
Where are fire incidents reported in Brook Park, OH
Something went wrong! Please refresh the page.
| Fire incidents reported | |
|---|---|
| Sreet name | Count |
| BROOKPARK RD | 218 |
| SNOW RD | 188 |
| HOLLAND RD | 136 |
| SHELDON RD | 84 |
| SMITH RD | 82 |
| ENGLE RD | 68 |
| FRY RD | 32 |
| HUMMEL RD | 32 |
| HENRY FORD BLVD | 30 |
| SYLVIA DR | 30 |
| 130 ST | 26 |
| EAST PARK CIR | 26 |
| GLENWAY DR | 24 |
| RT 237 | 24 |
| 150 ST | 22 |
| 161 ST | 22 |
| I 71 SOUTH BOUND IN BP | 22 |
| ELMDALE RD | 20 |
| MICHAEL DR | 20 |
| EASTLAND RD | 18 |
| I 71 NORTH BOUND IN BP | 16 |
| MIDDLEBROOK BLVD | 16 |
| PARK DR | 16 |
| RICHARD DR | 16 |
| 164 ST | 14 |
| GILMERE DR | 14 |
| HARDIN DR | 14 |
| HEATHERWOOD DR | 14 |
| STARLITE DR | 14 |
| EDGEHURST DR | 12 |
2002 - 2018 National Fire Incident Reporting System (NFIRS) incidents
- Incident types reported to NFIRS in Brook Park, OH
- 4,21048.1%Rescue & EMS
- 1,64418.8%Hazardous Condition
- 1,03811.9%Fire
- 8399.6%False Alarm
- 5155.9%Good Intent Call
- 4485.1%Service Call
- 520.6%Special Incident
- 100.1%Overpressure Rupture
- Fire incident types reported to NFIRS in Brook Park, OH
- 50048.2%Structure Fires
- 30629.5%Outside Fires
- 21921.1%Mobile Property/Vehicle Fires
- 131.3%Other
 Based on the data from the years 2002 - 2018 the average number of fire incidents per year is 61. The highest number of reported fires - 82 took place in 2003, and the least - 36 in 2018. The data has a declining trend.
The average number of yearly fire incidents per 10k residents in Brook Park, OH compared to nearest cities:
(Note: Based on data for the last 3 years, including only cities with population 5,000 and above)
| Brook Park: | 25.1 |
| Middleburg Heights: | 26.2 |
| Parma Heights: | 23.9 |
| Berea: | 43.9 |
| Fairview Park: | 33.2 |
| Brooklyn: | 42.3 |
| Parma: | 21.2 |
| Olmsted Falls: | 40.9 |
| North Olmsted: | 39.7 |
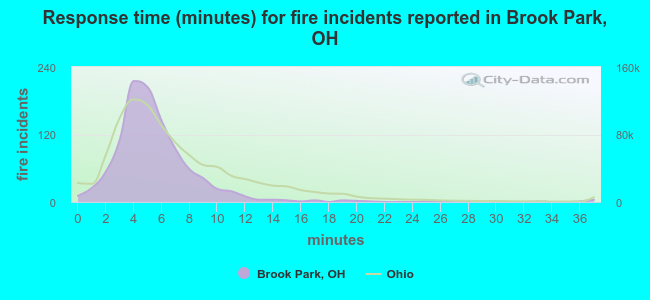 The median response time based on all reported fire incidents is 5 minutes. This is lower than the state median value.
The median response time in Brook Park, OH compared to nearest cities:
(Note: Based on data for all years, including only cities with at least 500 fire incidents)
| Brook Park: | 5 minutes |
| Parma Heights: | 3 minutes |
| Berea: | 5 minutes |
| Fairview Park: | 5 minutes |
| Brooklyn: | 4 minutes |
| Parma: | 4 minutes |
| North Olmsted: | 4 minutes |
| Rocky River: | 5 minutes |
| Lakewood: | 4 minutes |
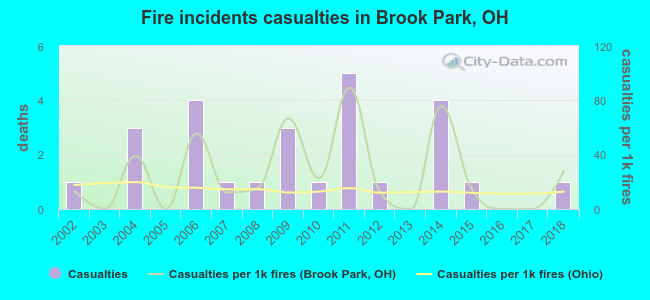 According to the reports from the years 2002 - 2018 the average number of fire-related casualties per year is 2. The highest number of reported casualties - 5 took place in 2011, and the lowest - 0 in 2003. The data has a constant trend.
The average number of casualties per 1,000 fires is 26. This indicator was the highest - 89 in 2011, and the lowest 0 in 2003. The trend for injuries per 1,000 incidents is increasing. Compared to the Ohio value the number of injuries per 1,000 fires is higher.
According to the reports from the years 2002 - 2018 the average number of fire-related casualties per year is 2. The highest number of reported casualties - 5 took place in 2011, and the lowest - 0 in 2003. The data has a constant trend.
The average number of casualties per 1,000 fires is 26. This indicator was the highest - 89 in 2011, and the lowest 0 in 2003. The trend for injuries per 1,000 incidents is increasing. Compared to the Ohio value the number of injuries per 1,000 fires is higher.Casualties per 1,000 incidents in Brook Park, OH compared to nearest cities:
(Note: Based on data for all years, including only cities with at least 500 fire incidents)
| Brook Park: | 25.0 |
| Parma Heights: | 43.3 |
| Berea: | 15.4 |
| Fairview Park: | 7.1 |
| Brooklyn: | 6.3 |
| Parma: | 19.1 |
| North Olmsted: | 10.2 |
| Rocky River: | 13.3 |
| Lakewood: | 33.3 |
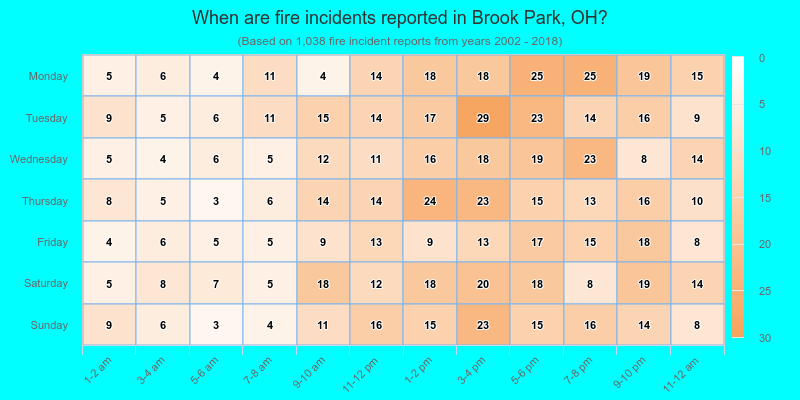
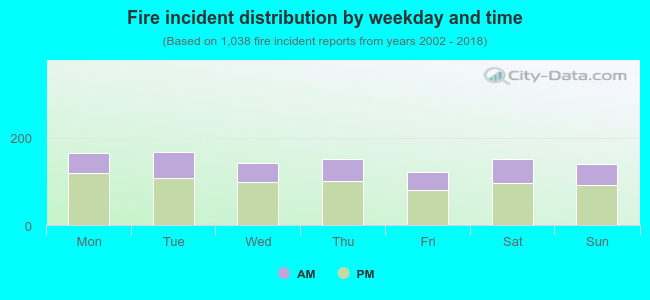 33.0% incidents where reported in the morning and 67.0% in the evening. The most fires (16.2%) took place on Tuesday, and the least (11.8%) on Friday.
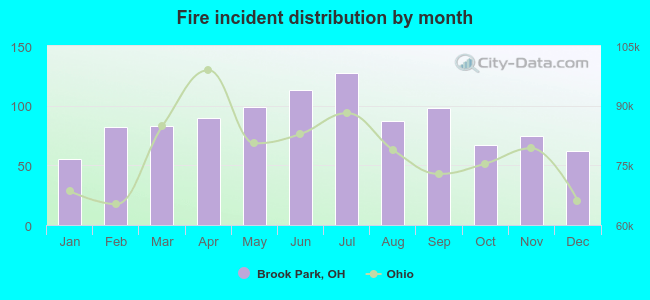 Based on the 1,038 reports from years 2002 - 2018 most fires (12.2%) took place during July, and the least (5.3%) in January.
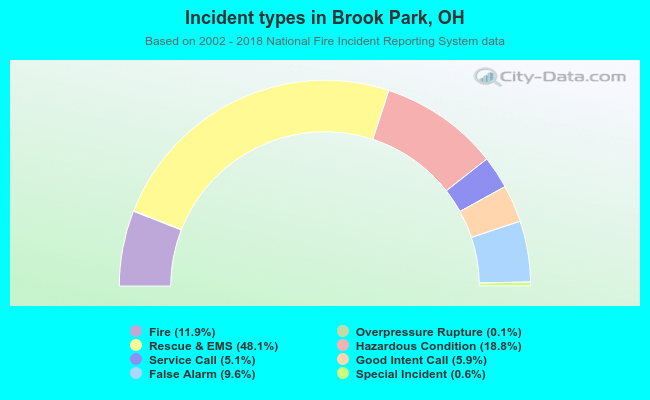 Out of all 8,756 cases reported during the years 2002 - 2018, the most belonged to the categories: Rescue & EMS (48.1%), Hazardous Condition (18.8%), and Fire (11.9%).
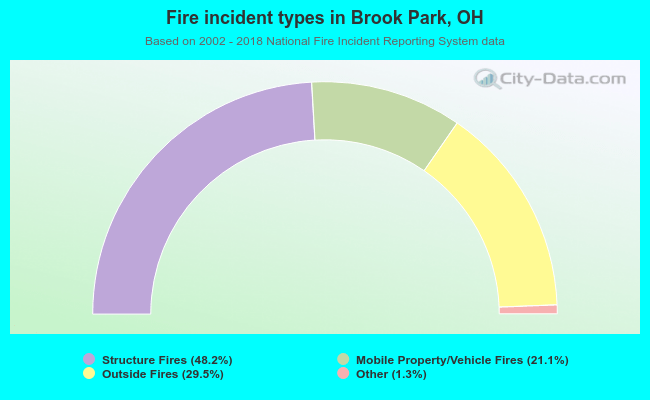 When looking into fire subcategories, the most reports belonged to: Structure Fires (48.2%), and Outside Fires (29.5%).