Haines City: Fire Incidents, Florida (FL)
Where are fire incidents reported in Haines City, FL
Something went wrong! Please refresh the page.
| Fire incidents reported | |
|---|---|
| Sreet name | Count |
| HIGHWAY 27 | 174 |
| HINSON AVE | 172 |
| JOHNSON AVE | 92 |
| 27 HWY | 70 |
| BAKER DAIRY RD | 66 |
| 10TH ST | 62 |
| 30TH ST | 62 |
| POLK CITY RD | 60 |
| HIGHWAY 17-92 | 58 |
| HATCHINEHA RD | 56 |
| BRADBURY RD | 48 |
| 1792 HWY | 46 |
| 20TH ST | 42 |
| BAKER AVE | 42 |
| BATES RD | 40 |
| KALOGRIDIS RD | 38 |
| LAKE HATCHINEHA RD | 38 |
| LAKE LOWERY RD | 38 |
| LAKE MARION CREEK RD | 38 |
| HIGHWAY 1792 | 36 |
| 7TH ST | 34 |
| AVENUE J | 32 |
| KOKOMO RD | 32 |
| BANNON ISLAND RD | 30 |
| CARL BOOZER RD | 30 |
| KENTUCKY ST | 30 |
| PENINSULAR DR | 30 |
| SHAMROCK RD | 30 |
| COMMERCE AVE | 28 |
| 544 HWY | 26 |
| Other | 872 |
2002 - 2018 National Fire Incident Reporting System (NFIRS) incidents
- Incident types reported to NFIRS in Haines City, FL
- 17,05865.8%Rescue & EMS
- 3,29112.7%Good Intent Call
- 2,4529.5%Fire
- 1,2294.7%Service Call
- 1,1194.3%Hazardous Condition
- 7362.8%False Alarm
- Fire incident types reported to NFIRS in Haines City, FL
- 1,23550.4%Outside Fires
- 73930.1%Structure Fires
- 41717.0%Mobile Property/Vehicle Fires
- 612.5%Other
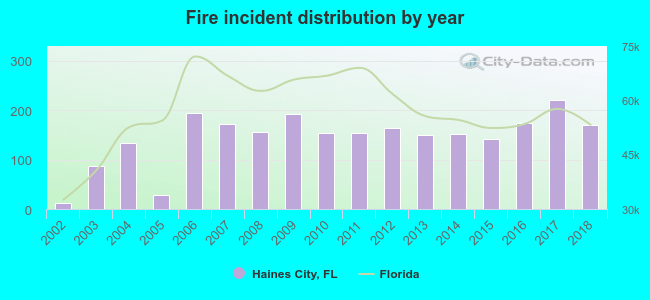 Based on the data from the years 2002 - 2018 the average number of fires per year is 144. The highest number of fires - 220 took place in 2017, and the least - 13 in 2002. The data has a growing trend.
The average number of yearly fire incidents per 10k residents in Haines City, FL compared to nearest cities:
(Note: Based on data for the last 3 years, including only cities with population 5,000 and above)
| Haines City: | 85.2 |
| Lake Alfred: | 43.8 |
| Winter Haven: | 100.1 |
| Poinciana: | 23.2 |
| Auburndale: | 92.3 |
| Wahneta: | 5.9 |
| Lake Wales: | 156.1 |
| Celebration: | 16.6 |
| Highland City: | 0.9 |
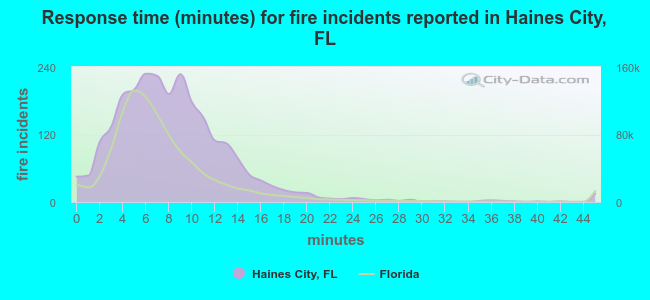 The median response time based on all reported fire incidents is 8 minutes. This is higher compared to the Florida median value.
The median response time in Haines City, FL compared to nearest cities:
(Note: Based on data for all years, including only cities with at least 500 fire incidents)
| Haines City: | 8 minutes |
| Davenport: | 9 minutes |
| Lake Alfred: | 5 minutes |
| Winter Haven: | 8 minutes |
| Poinciana: | 10 minutes |
| Auburndale: | 6 minutes |
| Polk City: | 11 minutes |
| Lake Wales: | 8 minutes |
| Kissimmee: | 8 minutes |
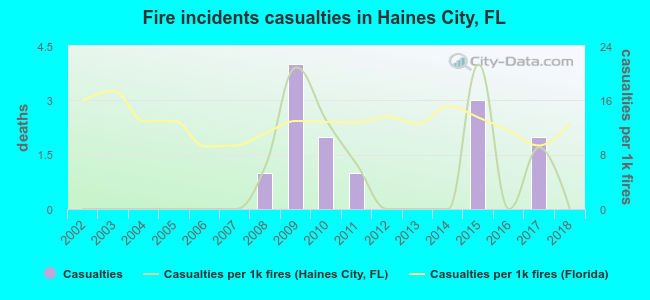 Based on the data from the years 2002 - 2018 the average number of fire-related yearly casualties is 1. The highest number of reported injuries - 4 took place in 2009, and the lowest - 0 in 2002. The data has a constant trend.
The average number of injuries per 1,000 fires is 5. This indicator was the highest - 21 in 2015, and the lowest 0 in 2002. The trend for casualties per 1,000 fires is constant. Compared to the Florida value the number of casualties per 1,000 fires is much lower.
Based on the data from the years 2002 - 2018 the average number of fire-related yearly casualties is 1. The highest number of reported injuries - 4 took place in 2009, and the lowest - 0 in 2002. The data has a constant trend.
The average number of injuries per 1,000 fires is 5. This indicator was the highest - 21 in 2015, and the lowest 0 in 2002. The trend for casualties per 1,000 fires is constant. Compared to the Florida value the number of casualties per 1,000 fires is much lower.Casualties per 1,000 incidents in Haines City, FL compared to nearest cities:
(Note: Based on data for all years, including only cities with at least 500 fire incidents)
| Haines City: | 5.3 |
| Davenport: | 4.7 |
| Lake Alfred: | 5.2 |
| Winter Haven: | 6.2 |
| Poinciana: | 15.3 |
| Auburndale: | 5.6 |
| Polk City: | 4.9 |
| Lake Wales: | 7.3 |
| Kissimmee: | 13.7 |
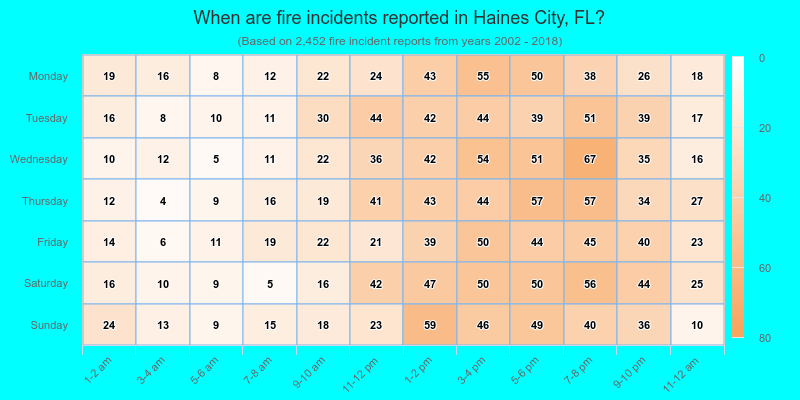
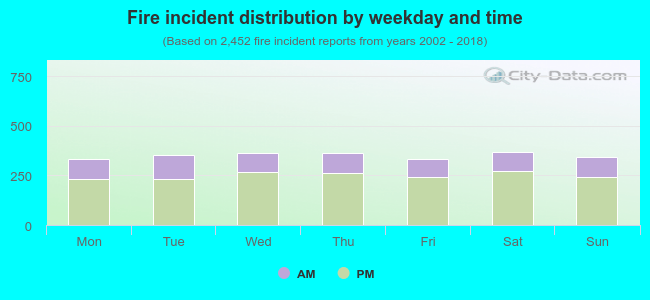 29.0% incidents where reported in the morning and 71.0% in the evening. The most fires (15.1%) took place on Saturday, and the least (13.5%) on Monday.
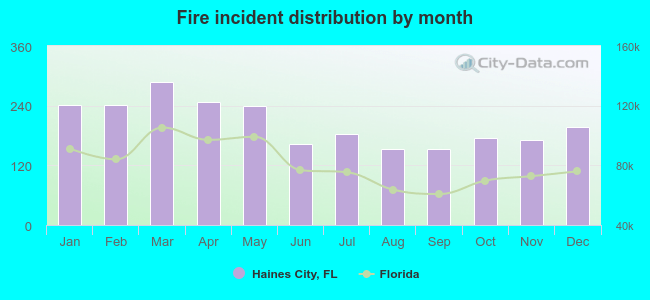 Based on the 2,452 incident reports from years 2002 - 2018 most fires (11.7%) took place during March, and the least (6.2%) in August.
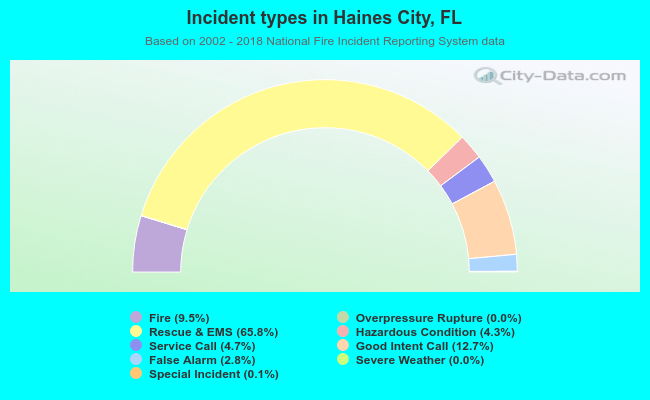 Out of all 25,921 cases reported during the years 2002 - 2018, the most belonged to the categories: Rescue & EMS (65.8%), Good Intent Call (12.7%), and Fire (9.5%).
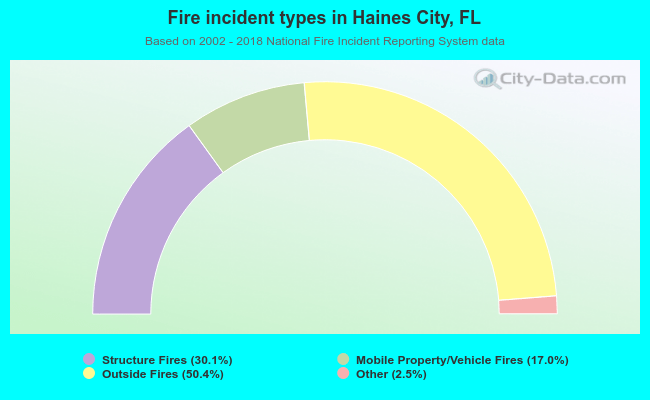 When looking into fire subcategories, the most incidents belonged to: Outside Fires (50.4%), and Structure Fires (30.1%).