Poinciana: Fire Incidents, Florida (FL)
Where are fire incidents reported in Poinciana, FL
Something went wrong! Please refresh the page.
| Fire incidents reported | |
|---|---|
| Sreet name | Count |
| MARIGOLD AVE | 70 |
| PLEASANT HILL RD | 58 |
| CYPRESS PKY | 46 |
| CYPRESS PKWY | 34 |
| KOA ST | 26 |
| CHESTNUT ST | 24 |
| CARLISLE CT | 18 |
| OLD PLEASANT HILL RD | 18 |
| ROYALTY CT | 18 |
| AMERICANA CT | 16 |
| CATALINA CT | 16 |
| CYPRESS | 16 |
| DUDLEY DR | 16 |
| FINCH CT | 16 |
| HARLAND CT | 16 |
| LAUREL AVE | 16 |
| PALMETTO ST | 16 |
| ADOUR DR | 14 |
| ALDERSHOT CT | 14 |
| AMIENS RD | 14 |
| BECKENHAM DR | 14 |
| BLUEBILL CT | 14 |
| GOLDEN FINCH WAY | 14 |
| HEMLOCK AVE | 14 |
| LARK CT | 14 |
| OGNON CT | 14 |
| POINCIANA BLVD | 14 |
| SAN LORENZO RD | 14 |
| SAN MIGUEL RD | 14 |
| VILLAGE DR | 14 |
| Other | 817 |
2005 - 2018 National Fire Incident Reporting System (NFIRS) incidents
- Incident types reported to NFIRS in Poinciana, FL
- 15,99770.4%Rescue & EMS
- 2,42810.7%Good Intent Call
- 1,4396.3%Fire
- 1,3065.7%Service Call
- 1,0734.7%False Alarm
- 4682.1%Hazardous Condition
- Fire incident types reported to NFIRS in Poinciana, FL
- 57740.1%Outside Fires
- 57640.0%Structure Fires
- 24517.0%Mobile Property/Vehicle Fires
- 412.8%Other
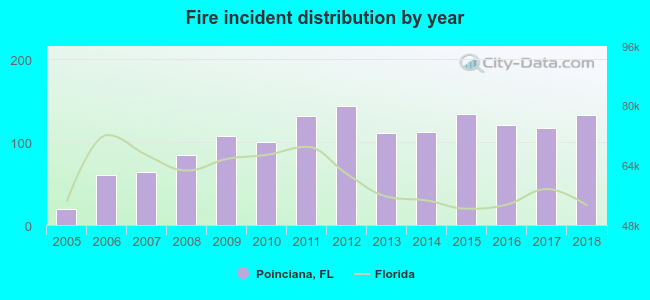 According to the data from the years 2005 - 2018 the average number of fire incidents per year is 103. The highest number of reported fire incidents - 144 took place in 2012, and the least - 19 in 2005. The data has a rising trend.
The average number of yearly fire incidents per 10k residents in Poinciana, FL compared to nearest cities:
(Note: Based on data for the last 3 years, including only cities with population 5,000 and above)
| Poinciana: | 23.2 |
| Haines City: | 85.2 |
| Kissimmee: | 50.3 |
| Celebration: | 16.6 |
| Lake Alfred: | 43.8 |
| Winter Haven: | 100.1 |
| Lake Wales: | 156.1 |
| Auburndale: | 92.3 |
| Wahneta: | 5.9 |
 The median response time based on all reported fire incidents is 10 minutes. This is higher than the Florida median value.
The median response time in Poinciana, FL compared to nearest cities:
(Note: Based on data for all years, including only cities with at least 500 fire incidents)
| Poinciana: | 10 minutes |
| Davenport: | 9 minutes |
| Haines City: | 8 minutes |
| Kissimmee: | 8 minutes |
| St. Cloud: | 6 minutes |
| Lake Alfred: | 5 minutes |
| Winter Haven: | 8 minutes |
| Lake Wales: | 8 minutes |
| Auburndale: | 6 minutes |
 According to the reports from the years 2005 - 2018 the average number of fire-related casualties per year is 2. The highest number of reported casualties - 5 took place in 2012, and the lowest - 0 in 2005. The data has a constant trend.
The average number of casualties per 1,000 fires is 13. This indicator was the highest - 35 in 2012, and the lowest 0 in 2005. The trend for injuries per 1,000 incidents is declining. Compared to the state value the number of casualties per 1,000 incidents is higher.
According to the reports from the years 2005 - 2018 the average number of fire-related casualties per year is 2. The highest number of reported casualties - 5 took place in 2012, and the lowest - 0 in 2005. The data has a constant trend.
The average number of casualties per 1,000 fires is 13. This indicator was the highest - 35 in 2012, and the lowest 0 in 2005. The trend for injuries per 1,000 incidents is declining. Compared to the state value the number of casualties per 1,000 incidents is higher.Casualties per 1,000 incidents in Poinciana, FL compared to nearest cities:
(Note: Based on data for all years, including only cities with at least 500 fire incidents)
| Poinciana: | 15.3 |
| Davenport: | 4.7 |
| Haines City: | 5.3 |
| Kissimmee: | 13.7 |
| St. Cloud: | 15.0 |
| Lake Alfred: | 5.2 |
| Winter Haven: | 6.2 |
| Lake Wales: | 7.3 |
| Auburndale: | 5.6 |
 23.6% incidents where reported in the morning and 76.4% in the evening. The most fires (15.4%) took place on Wednesday, and the least (13.1%) on Thursday.
 According to the 1,439 fires from years 2005 - 2018 most fires (13.9%) took place during March, and the least (5.5%) in August.
 Out of all 22,727 cases reported during the years 2005 - 2018, the most belonged to the categories: Rescue & EMS (70.4%), Good Intent Call (10.7%), and Fire (6.3%).
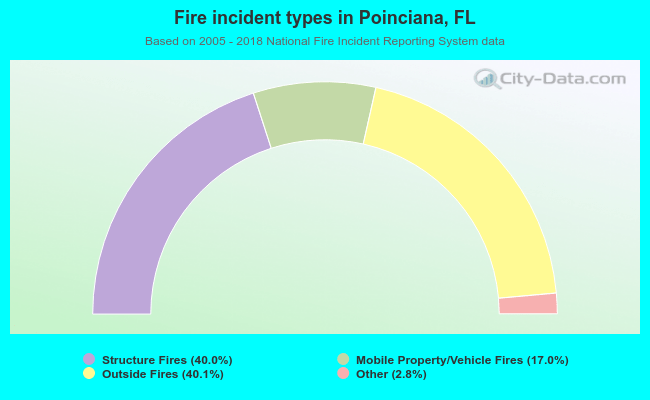 When looking into fire subcategories, the most incidents belonged to: Outside Fires (40.1%), and Structure Fires (40.0%).