Highland: Fire Incidents, New York (NY)
Where are fire incidents reported in Highland, NY
Something went wrong! Please refresh the page.
|
| |||||||||||||||||||||||||||||||||||||||||||||||||||||||||||||||||||||||||||||||||||||||||||||||||||||||||||||
2003 - 2018 National Fire Incident Reporting System (NFIRS) incidents
- Incident types reported to NFIRS in Highland, NY
- 81429.2%Hazardous Condition
- 53519.2%False Alarm
- 51118.3%Rescue & EMS
- 40614.6%Fire
- 30010.8%Good Intent Call
- 2147.7%Service Call
- 30.1%Overpressure Rupture
- Fire incident types reported to NFIRS in Highland, NY
- 27768.2%Structure Fires
- 6215.3%Mobile Property/Vehicle Fires
- 6014.8%Outside Fires
- 71.7%Other
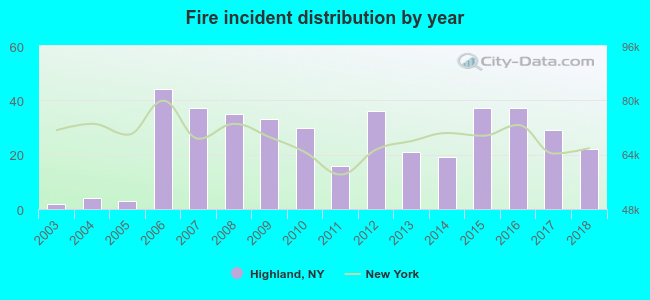 According to the data from the years 2003 - 2018 the average number of fire incidents per year is 25. The highest number of fires - 44 took place in 2006, and the least - 2 in 2003. The data has an increasing trend.
The average number of yearly fire incidents per 10k residents in Highland, NY compared to nearest cities:
(Note: Based on data for the last 3 years, including only cities with population 5,000 and above)
| Highland: | 51.9 |
| Lloyd: | 1.8 |
| Poughkeepsie: | 271.6 |
| Fairview: | 1.8 |
| Hyde Park: | 57.2 |
| New Paltz: | 63.6 |
| Wappingers Falls: | 152.6 |
| Wappinger: | 5.2 |
| Esopus: | 8.8 |

 31.8% incidents where reported in the morning and 68.2% in the evening. The most fires (16.5%) took place on Saturday, and the least (11.6%) on Thursday.
 According to the 406 fire incident reports from years 2003 - 2018 most fires (12.3%) took place during March, and the least (4.2%) in September.
 Out of all 2,785 cases reported during the years 2003 - 2018, the most belonged to the categories: Hazardous Condition (29.2%), False Alarm (19.2%), and Rescue & EMS (18.3%).
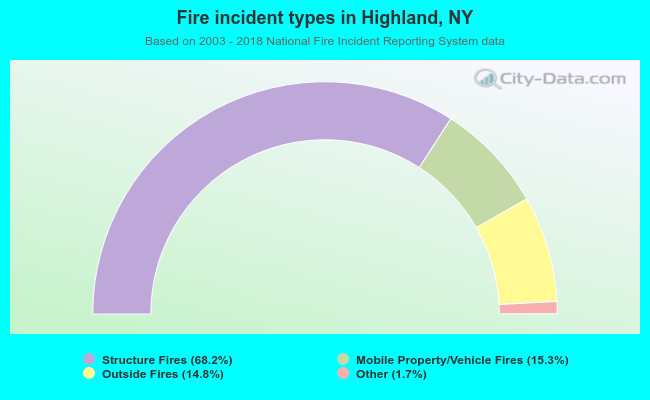 When looking into fire subcategories, the most reports belonged to: Structure Fires (68.2%), and Mobile Property/Vehicle Fires (15.3%).