Hinsdale: Fire Incidents, Illinois (IL)
Where are fire incidents reported in Hinsdale, IL
Something went wrong! Please refresh the page.
| Fire incidents reported | |
|---|---|
| Sreet name | Count |
| MADISON ST | 84 |
| GRANT ST | 62 |
| I-294 TRI-STATE TOLLWAY | 56 |
| WASHINGTON ST | 48 |
| OGDEN AVE | 44 |
| COUNTY LINE RD | 42 |
| ELM ST | 34 |
| WALNUT ST | 32 |
| BODIN ST | 30 |
| LINCOLN ST | 30 |
| OAK ST | 30 |
| WALNUT | 28 |
| PHILLIPPA ST | 26 |
| TOLLWAY DR | 26 |
| ADAMS ST | 24 |
| HINSDALE AVE | 24 |
| YORK RD | 24 |
| GARFIELD ST | 22 |
| SPINNING WHEEL RD | 22 |
| BRUNER ST | 20 |
| JEFFERSON ST | 20 |
| 59TH ST | 18 |
| BODIN | 18 |
| I294 TRISTATE TOLLWAY | 18 |
| THIRD ST | 18 |
| 57TH ST | 16 |
| IVY LN | 16 |
| JEANS RD | 16 |
| MONROE ST | 16 |
| ROUTE 83 | 16 |
| Other | 112 |
2002 - 2018 National Fire Incident Reporting System (NFIRS) incidents
- Incident types reported to NFIRS in Hinsdale, IL
- 5,33936.4%Rescue & EMS
- 3,17121.6%False Alarm
- 2,45616.7%Hazardous Condition
- 1,47910.1%Service Call
- 1,1988.2%Good Intent Call
- 9926.8%Fire
- 210.1%Overpressure Rupture
- 170.1%Severe Weather
- Fire incident types reported to NFIRS in Hinsdale, IL
- 53053.4%Structure Fires
- 26426.6%Outside Fires
- 15715.8%Mobile Property/Vehicle Fires
- 414.1%Other
 According to the data from the years 2002 - 2018 the average number of fire incidents per year is 58. The highest number of reported fire incidents - 96 took place in 2009, and the least - 7 in 2002. The data has a rising trend.
The average number of yearly fire incidents per 10k residents in Hinsdale, IL compared to nearest cities:
(Note: Based on data for the last 3 years, including only cities with population 5,000 and above)
| Hinsdale: | 25.2 |
| Western Springs: | 18.3 |
| Clarendon Hills: | 17.3 |
| Westmont: | 22.6 |
| Willowbrook: | 46.0 |
| La Grange: | 20.1 |
| Oak Brook: | 71.9 |
| Countryside: | 48.1 |
| Burr Ridge: | 28.8 |
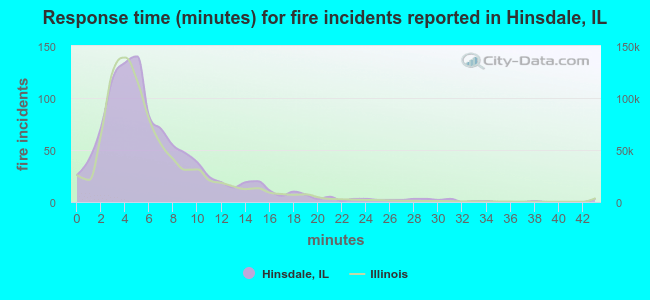 The median response time based on all reported fire incidents is 5 minutes. This is about the same as the Illinois median value.
The median response time in Hinsdale, IL compared to nearest cities:
(Note: Based on data for all years, including only cities with at least 500 fire incidents)
| Hinsdale: | 5 minutes |
| Westmont: | 5 minutes |
| Willowbrook: | 5 minutes |
| Oak Brook: | 5 minutes |
| Burr Ridge: | 7 minutes |
| Westchester: | 4 minutes |
| Brookfield: | 5 minutes |
| Downers Grove: | 5 minutes |
| Darien: | 5 minutes |
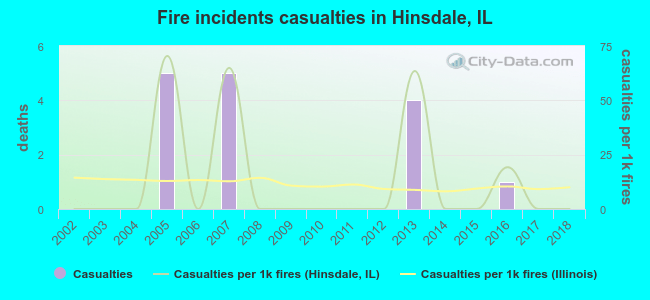 Based on the reports from the years 2002 - 2018 the average number of fire-related casualties per year is 1. The highest number of reported casualties - 5 took place in 2005, and the lowest - 0 in 2002. The data has a constant trend.
The average number of injuries per 1,000 fires is 13. This indicator was the highest - 70 in 2005, and the lowest 0 in 2002. The trend for injuries per 1,000 fires is constant. Compared to the Illinois value the number of injuries per 1,000 incidents is higher.
Based on the reports from the years 2002 - 2018 the average number of fire-related casualties per year is 1. The highest number of reported casualties - 5 took place in 2005, and the lowest - 0 in 2002. The data has a constant trend.
The average number of injuries per 1,000 fires is 13. This indicator was the highest - 70 in 2005, and the lowest 0 in 2002. The trend for injuries per 1,000 fires is constant. Compared to the Illinois value the number of injuries per 1,000 incidents is higher.Casualties per 1,000 incidents in Hinsdale, IL compared to nearest cities:
(Note: Based on data for all years, including only cities with at least 500 fire incidents)
| Hinsdale: | 15.1 |
| Westmont: | 21.2 |
| Willowbrook: | 14.9 |
| Oak Brook: | 10.9 |
| Burr Ridge: | 14.3 |
| Westchester: | 15.6 |
| Brookfield: | 19.1 |
| Downers Grove: | 21.9 |
| Darien: | 12.9 |
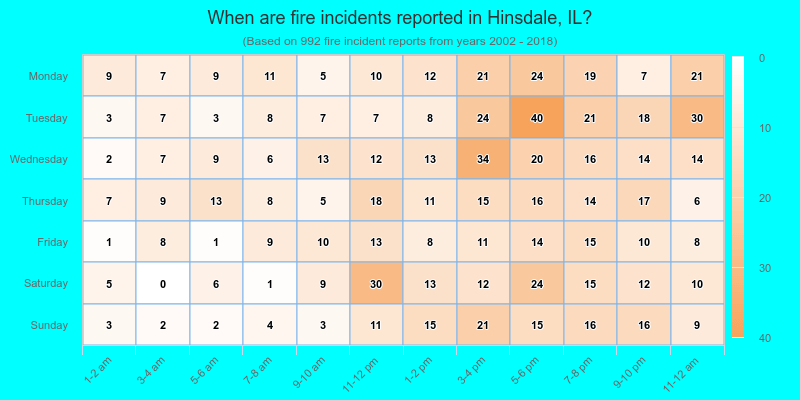
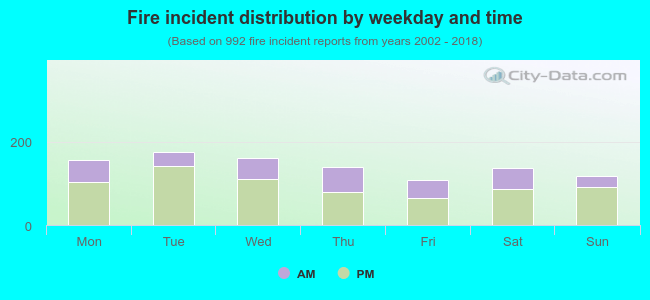 31.6% incidents where reported in the morning and 68.4% in the evening. The most fires (17.7%) took place on Tuesday, and the least (10.9%) on Friday.
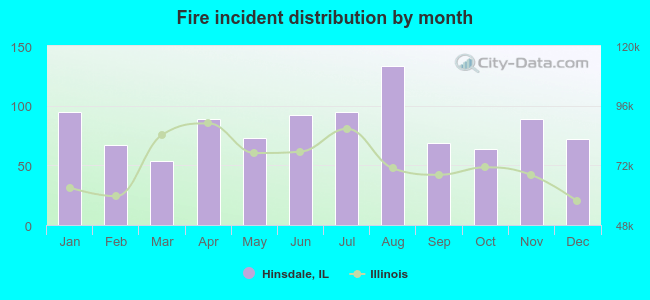 According to the 992 incident reports from years 2002 - 2018 most fires (13.4%) took place during August, and the least (5.4%) in March.
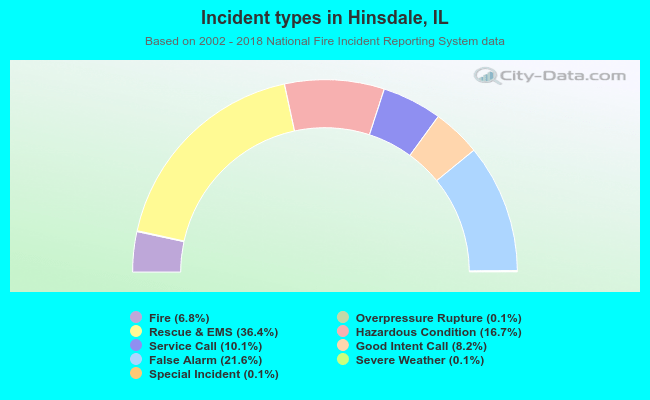 Out of all 14,686 cases reported during the years 2002 - 2018, the most belonged to the categories: Rescue & EMS (36.4%), False Alarm (21.6%), and Hazardous Condition (16.7%).
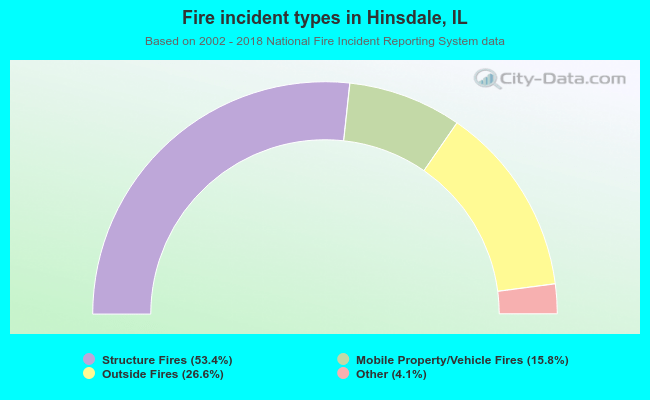 When looking into fire subcategories, the most incidents belonged to: Structure Fires (53.4%), and Outside Fires (26.6%).