Western Springs: Fire Incidents, Illinois (IL)
Where are fire incidents reported in Western Springs, IL
Something went wrong! Please refresh the page.
|
| |||||||||||||||||||||||||||||||||||||||||||||||||||||||||||||||||||||||||||||||||||||||||||||||||||||||||||||
2002 - 2018 National Fire Incident Reporting System (NFIRS) incidents
- Incident types reported to NFIRS in Western Springs, IL
- 2,87939.0%Rescue & EMS
- 1,65722.5%Hazardous Condition
- 1,08614.7%False Alarm
- 6508.8%Good Intent Call
- 6248.5%Service Call
- 4696.4%Fire
- Fire incident types reported to NFIRS in Western Springs, IL
- 25353.9%Structure Fires
- 13629.0%Outside Fires
- 5110.9%Other
- 296.2%Mobile Property/Vehicle Fires
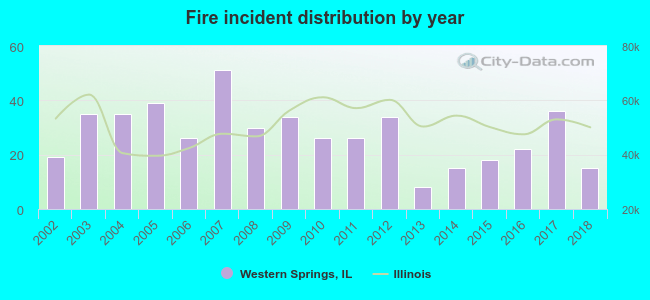 Based on the data from the years 2002 - 2018 the average number of fire incidents per year is 28. The highest number of fire incidents - 51 took place in 2007, and the least - 8 in 2013. The data has a dropping trend.
The average number of yearly fire incidents per 10k residents in Western Springs, IL compared to nearest cities:
(Note: Based on data for the last 3 years, including only cities with population 5,000 and above)
| Western Springs: | 18.3 |
| La Grange: | 20.1 |
| Hinsdale: | 25.2 |
| Countryside: | 48.1 |
| La Grange Park: | 15.4 |
| Clarendon Hills: | 17.3 |
| Brookfield: | 36.6 |
| Westchester: | 37.1 |
| Oak Brook: | 71.9 |
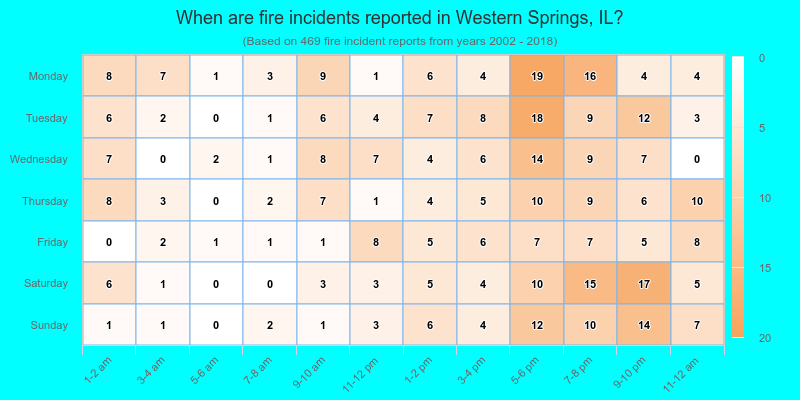
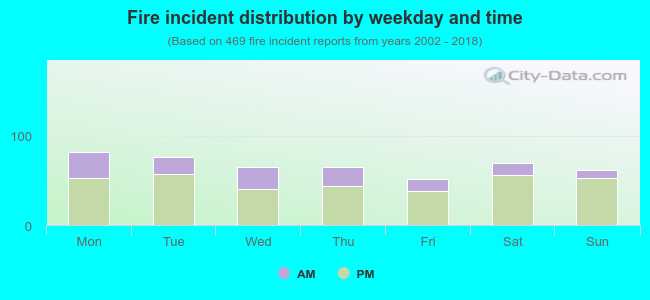 27.3% incidents where reported in the morning and 72.7% in the evening. The most fires (17.5%) took place on Monday, and the least (10.9%) on Friday.
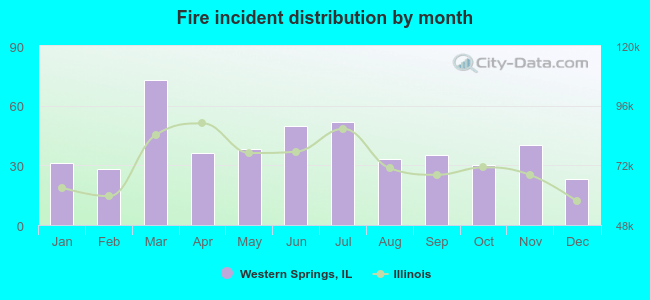 Based on the 469 fire incident reports from years 2002 - 2018 most fires (15.6%) took place during March, and the least (4.9%) in December.
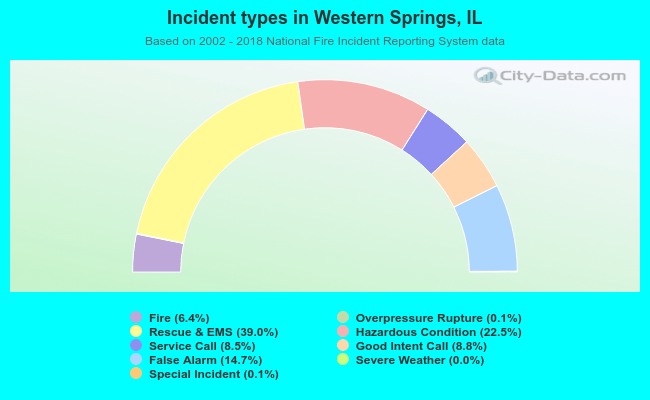 Out of all 7,378 cases reported during the years 2002 - 2018, the most belonged to the categories: Rescue & EMS (39.0%), Hazardous Condition (22.5%), and False Alarm (14.7%).
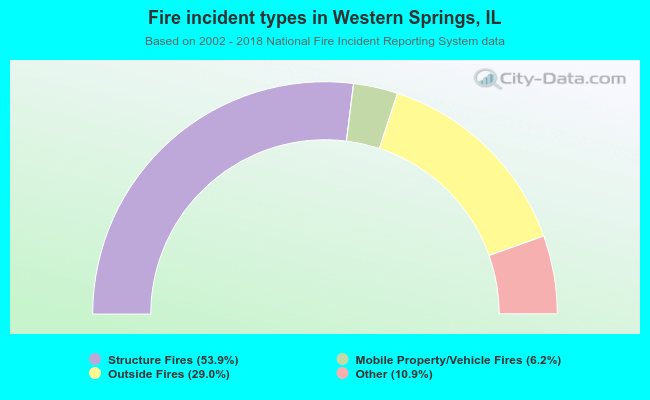 When looking into fire subcategories, the most incidents belonged to: Structure Fires (53.9%), and Outside Fires (29.0%).