Hot Springs Village: Fire Incidents, Arkansas (AR)
Where are fire incidents reported in Hot Springs Village, AR
Something went wrong! Please refresh the page.
|
| |||||||||||||||||||||||||||||||||||||||||||||||||||||||||||||||||||||||||||||||||||||||||||||||||||||||||||||
| Other | 106 | |||||||||||||||||||||||||||||||||||||||||||||||||||||||||||||||||||||||||||||||||||||||||||||||||||||||||||||
2002 - 2018 National Fire Incident Reporting System (NFIRS) incidents
- Incident types reported to NFIRS in Hot Springs Village, AR
- 1,26245.2%Rescue & EMS
- 45016.1%Service Call
- 39614.2%Fire
- 2478.9%Good Intent Call
- 2057.3%False Alarm
- 1957.0%Hazardous Condition
- 250.9%Severe Weather
- 70.3%Overpressure Rupture
- 30.1%Special Incident
- Fire incident types reported to NFIRS in Hot Springs Village, AR
- 19850.0%Structure Fires
- 13834.8%Outside Fires
- 369.1%Mobile Property/Vehicle Fires
- 246.1%Other
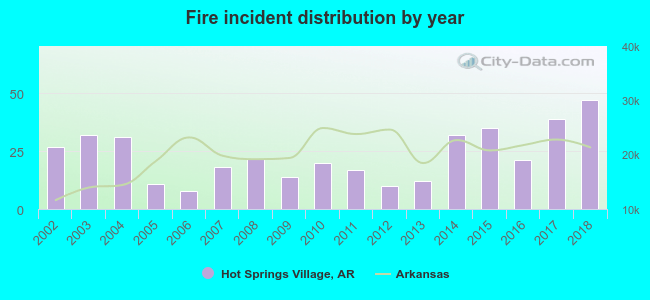 Based on the data from the years 2002 - 2018 the average number of fire incidents per year is 23. The highest number of reported fires - 47 took place in 2018, and the least - 8 in 2006. The data has an increasing trend.
The average number of yearly fire incidents per 10k residents in Hot Springs Village, AR compared to nearest cities:
(Note: Based on data for the last 3 years, including only cities with population 5,000 and above)
| Hot Springs Village: | 27.8 |
| Hot Springs: | 127.3 |
| Malvern: | 210.6 |
| Benton: | 96.6 |
| Bryant: | 54.2 |
| Maumelle: | 23.6 |
| Morrilton: | 87.4 |
| Arkadelphia: | 80.4 |
| Little Rock: | 80.1 |
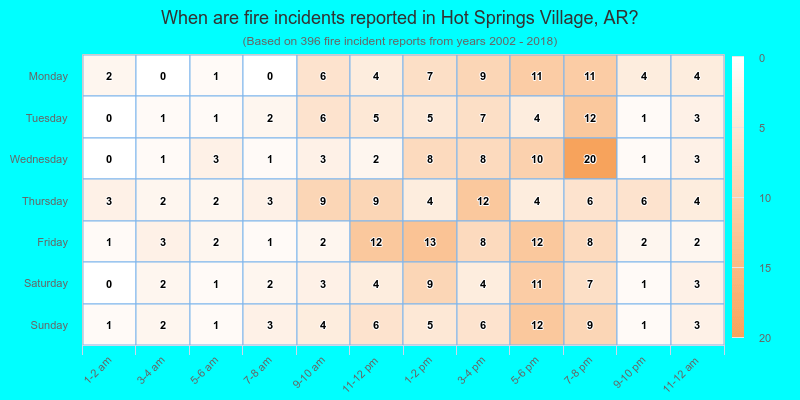
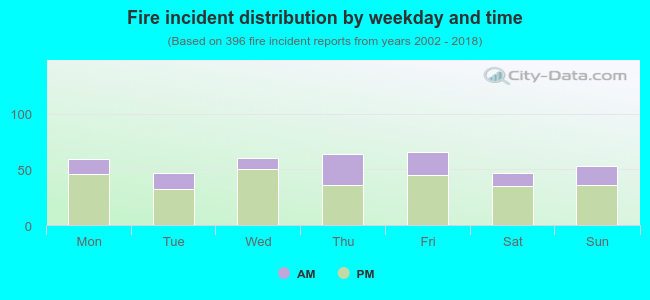 29.3% incidents where reported in the morning and 70.7% in the evening. The most fires (16.7%) took place on Friday, and the least (11.9%) on Tuesday.
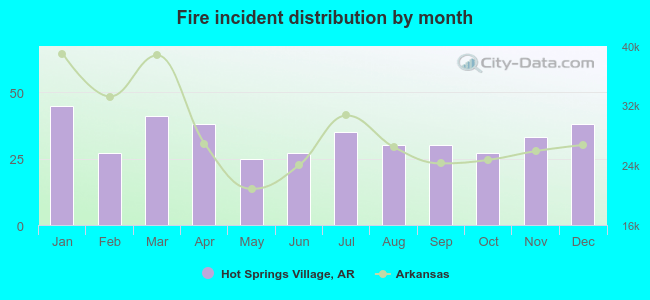 According to the 396 fire incident reports from years 2002 - 2018 most fires (11.4%) took place during January, and the least (6.3%) in May.
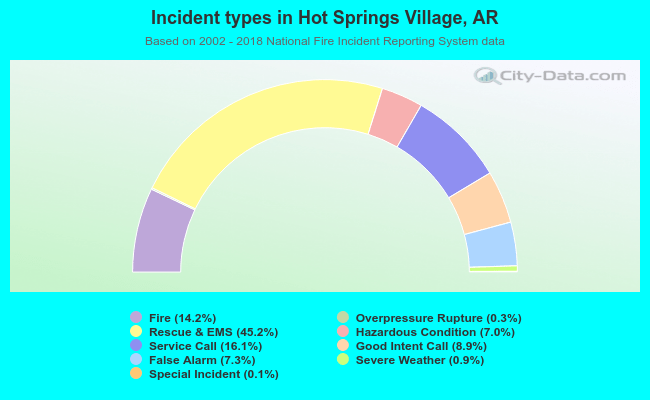 Out of all 2,790 cases reported during the years 2002 - 2018, the most belonged to the categories: Rescue & EMS (45.2%), Service Call (16.1%), and Fire (14.2%).
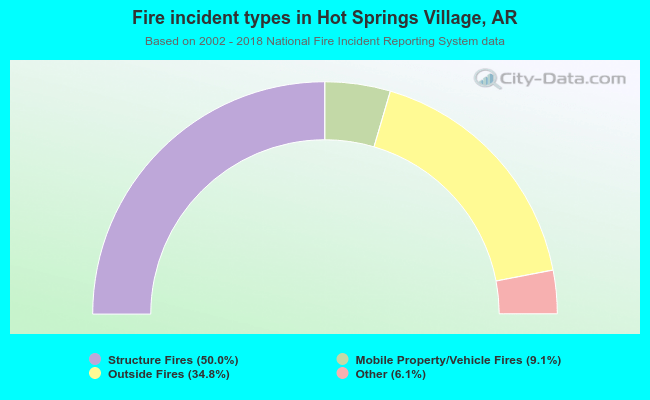 When looking into fire subcategories, the most incidents belonged to: Structure Fires (50.0%), and Outside Fires (34.8%).