Benton: Fire Incidents, Arkansas (AR)
Where are fire incidents reported in Benton, AR
Something went wrong! Please refresh the page.
| Fire incidents reported | |
|---|---|
| Sreet name | Count |
| I30 | 262 |
| I-30 | 212 |
| HWY 67 | 182 |
| HIGHWAY 5 | 164 |
| CONGO RD | 152 |
| HWY 5 | 142 |
| MILITARY | 114 |
| HIGHWAY 298 | 104 |
| ALCOA | 94 |
| EDISON | 86 |
| SALEM RD | 72 |
| CONGO | 68 |
| STEEL BRIDGE RD | 68 |
| SAMPLES RD | 62 |
| SALT CREEK RD | 56 |
| HWY 35 | 54 |
| ALCOA RD | 52 |
| REED | 48 |
| SILICA HEIGHTS | 48 |
| HENRY ST | 42 |
| MARKET ST | 42 |
| RIVER RIDGE RD | 42 |
| GRAY ST | 40 |
| RIVER | 38 |
| SCOTT SALEM RD | 38 |
| SEVIER | 38 |
| FAIRPLAY RD | 36 |
| GRAHAM ROAD | 36 |
| SEVIER ST | 36 |
| SILICA HEIGHTS RD | 36 |
| Other | 2,349 |
2002 - 2018 National Fire Incident Reporting System (NFIRS) incidents
- Incident types reported to NFIRS in Benton, AR
- 14,79654.8%Rescue & EMS
- 4,81317.8%Fire
- 2,6289.7%Good Intent Call
- 2,0137.5%Service Call
- 1,4125.2%Hazardous Condition
- 1,1834.4%False Alarm
- 920.3%Special Incident
- 580.2%Severe Weather
- Fire incident types reported to NFIRS in Benton, AR
- 2,51352.2%Outside Fires
- 1,68335.0%Structure Fires
- 49910.4%Mobile Property/Vehicle Fires
- 1182.5%Other
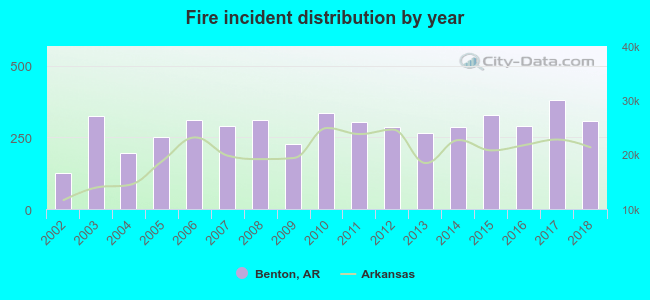 Based on the data from the years 2002 - 2018 the average number of fires per year is 283. The highest number of reported fires - 379 took place in 2017, and the least - 127 in 2002. The data has an increasing trend.
The average number of yearly fire incidents per 10k residents in Benton, AR compared to nearest cities:
(Note: Based on data for the last 3 years, including only cities with population 5,000 and above)
| Benton: | 96.6 |
| Bryant: | 54.2 |
| East End: | 1.4 |
| Little Rock: | 80.1 |
| Malvern: | 210.6 |
| Maumelle: | 23.6 |
| North Little Rock: | 87.9 |
| Hot Springs Village: | 27.8 |
| Sherwood: | 68.3 |
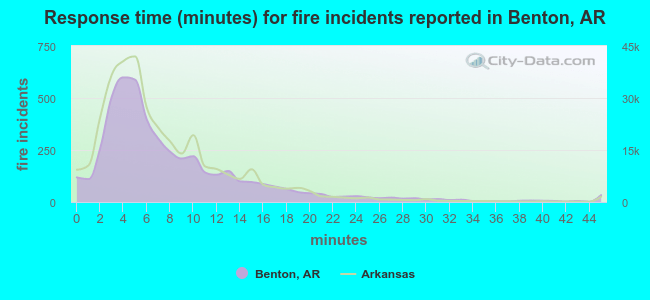 The median response time based on all reported fire incidents is 6 minutes. This is about the same as the state median value.
The median response time in Benton, AR compared to nearest cities:
(Note: Based on data for all years, including only cities with at least 500 fire incidents)
| Benton: | 6 minutes |
| Bauxite: | 10 minutes |
| Bryant: | 5 minutes |
| Alexander: | 9 minutes |
| Little Rock: | 5 minutes |
| Malvern: | 6 minutes |
| Sheridan: | 10 minutes |
| Hensley: | 10 minutes |
| Maumelle: | 3 minutes |
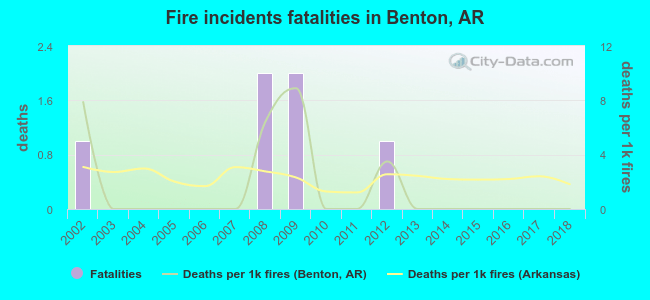 Based on the data from the years 2002 - 2018 the average number of fire-related yearly deaths is 0. The highest number of reported deaths - 2 took place in 2008, and the lowest - 0 in 2003. The data has a declining trend.
The average number of deaths per 1,000 fires is 2. This indicator was the highest - 9 in 2009, and the lowest 0 in 2003. The trend for fatalities per 1,000 fire incidents is dropping. Compared to the state value the number of deaths per 1,000 fires is lower.
Based on the data from the years 2002 - 2018 the average number of fire-related yearly deaths is 0. The highest number of reported deaths - 2 took place in 2008, and the lowest - 0 in 2003. The data has a declining trend.
The average number of deaths per 1,000 fires is 2. This indicator was the highest - 9 in 2009, and the lowest 0 in 2003. The trend for fatalities per 1,000 fire incidents is dropping. Compared to the state value the number of deaths per 1,000 fires is lower.Deaths per 1,000 incidents in Benton, AR compared to nearest cities:
(Note: Based on data for all years, including only cities with at least 2,500 fire incidents)
| Benton: | 1.2 |
| Little Rock: | 1.4 |
| Malvern: | 5.0 |
| North Little Rock: | 2.3 |
| Sherwood: | 0.7 |
| Hot Springs: | 4.8 |
| Jacksonville: | 1.6 |
| Conway: | 2.7 |
| Pine Bluff: | 1.5 |
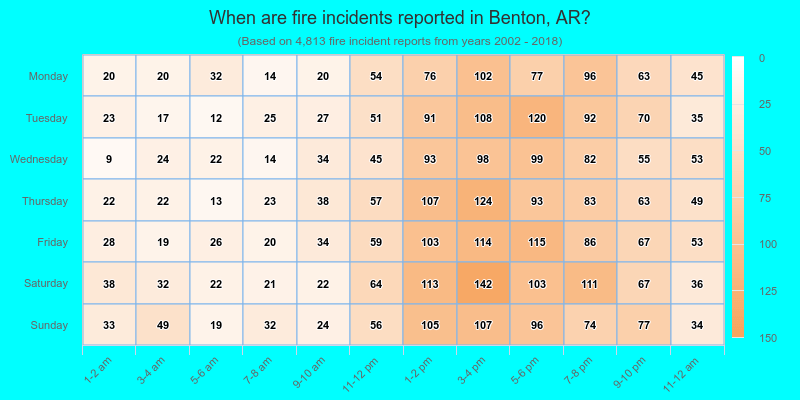
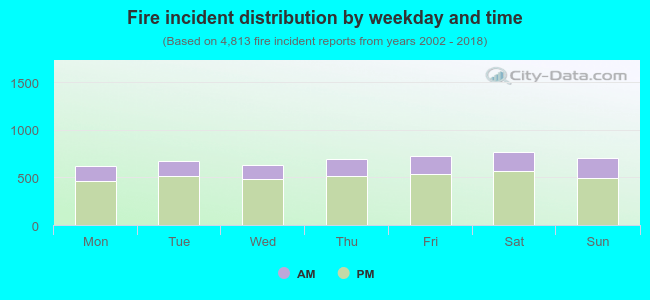 25.7% incidents where reported in the morning and 74.3% in the evening. The most fires (16.0%) took place on Saturday, and the least (12.9%) on Monday.
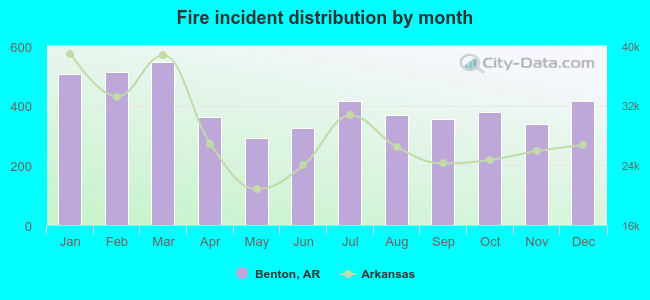 According to the 4,813 incident reports from years 2002 - 2018 most fires (11.3%) took place during March, and the least (6.1%) in May.
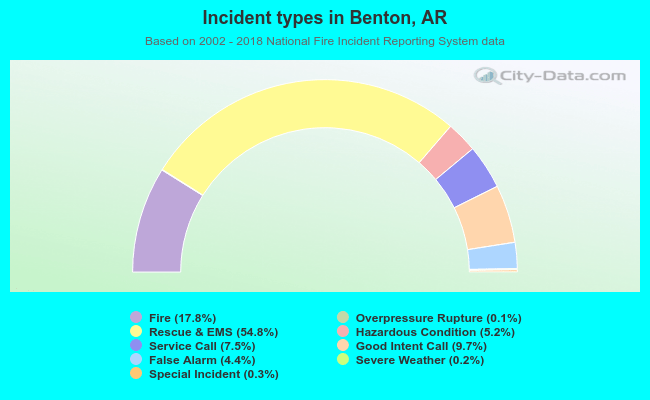 Out of all 27,019 cases reported during the years 2002 - 2018, the most belonged to the categories: Rescue & EMS (54.8%), Fire (17.8%), and Good Intent Call (9.7%).
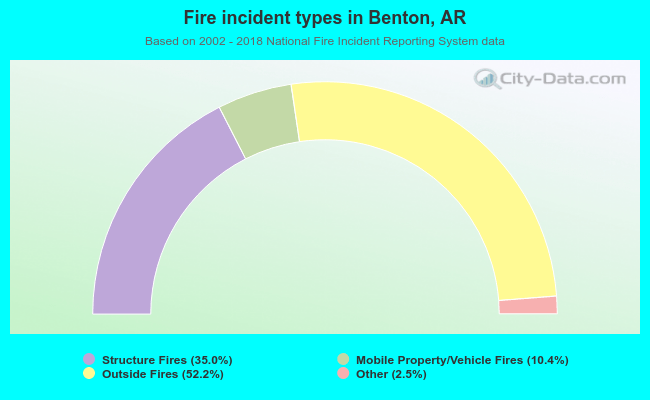 When looking into fire subcategories, the most incidents belonged to: Outside Fires (52.2%), and Structure Fires (35.0%).