Sherwood: Fire Incidents, Arkansas (AR)
Where are fire incidents reported in Sherwood, AR
Something went wrong! Please refresh the page.
| Fire incidents reported | |
|---|---|
| Sreet name | Count |
| BROCKINGTON RD | 126 |
| KIEHL AVE | 118 |
| WARDEN RD | 106 |
| LANDERS RD | 102 |
| RIXIE RD | 98 |
| EAST KIEHL AVE | 88 |
| BATESVILLE PIKE | 74 |
| AR SH 107 HWY | 64 |
| WILDWOOD AVE | 60 |
| MANSON RD | 58 |
| STATE HIGHWAY 107 | 58 |
| COUNTRY CLUB RD | 54 |
| CHERRIE AVE | 50 |
| RIXEY RD | 48 |
| TRAMMEL RD | 44 |
| OLD TOM BOX RD | 38 |
| US HIGHWAY 67/167 | 34 |
| BEVERLY AVE | 30 |
| HWY 107 | 30 |
| HIGHWAY 107 | 28 |
| KELLOG ACRES RD | 28 |
| JACKSONVILLE CUTOFF RD | 26 |
| JACKSONVILLECATO RD | 24 |
| LEE AVE | 22 |
| REPUBLICAN RD | 22 |
| ALOHA CIR | 20 |
| CLUB RD | 20 |
| HATCHER RD | 20 |
| LOOP RD | 20 |
| PETERS RD | 20 |
| Other | 1,164 |
2002 - 2018 National Fire Incident Reporting System (NFIRS) incidents
- Incident types reported to NFIRS in Sherwood, AR
- 12,48162.1%Rescue & EMS
- 2,69413.4%Fire
- 1,3156.5%Good Intent Call
- 1,2456.2%Hazardous Condition
- 1,1885.9%False Alarm
- 1,0845.4%Service Call
- 530.3%Severe Weather
- 300.1%Overpressure Rupture
- Fire incident types reported to NFIRS in Sherwood, AR
- 1,34049.7%Structure Fires
- 89933.4%Outside Fires
- 33812.5%Mobile Property/Vehicle Fires
- 1174.3%Other
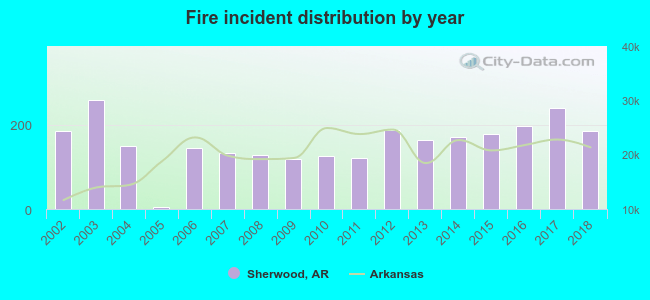 Based on the data from the years 2002 - 2018 the average number of fires per year is 158. The highest number of fires - 258 took place in 2003, and the least - 5 in 2005. The data has a growing trend.
The average number of yearly fire incidents per 10k residents in Sherwood, AR compared to nearest cities:
(Note: Based on data for the last 3 years, including only cities with population 5,000 and above)
| Sherwood: | 68.3 |
| North Little Rock: | 87.9 |
| Jacksonville: | 71.7 |
| Little Rock: | 80.1 |
| Maumelle: | 23.6 |
| Cabot: | 64.8 |
| East End: | 1.4 |
| Bryant: | 54.2 |
| Conway: | 51.4 |
 The median response time based on all reported fire incidents is 4 minutes. This is lower than the state median value.
The median response time in Sherwood, AR compared to nearest cities:
(Note: Based on data for all years, including only cities with at least 500 fire incidents)
| Sherwood: | 4 minutes |
| North Little Rock: | 5 minutes |
| Jacksonville: | 5 minutes |
| Little Rock: | 5 minutes |
| Maumelle: | 3 minutes |
| Scott: | 9 minutes |
| Cabot: | 6 minutes |
| Mayflower: | 11 minutes |
| Vilonia: | 6 minutes |
 According to the data from the years 2002 - 2018 the average number of fire-related casualties per year is 0. The highest number of reported injuries - 1 took place in 2002, and the lowest - 0 in 2003. The data has a constant trend.
The average number of casualties per 1,000 fire incidents is 1. This indicator was the highest - 6 in 2013, and the lowest 0 in 2003. The trend for injuries per 1,000 fire incidents is declining. Compared to the state value the number of casualties per 1,000 fires is much lower.
According to the data from the years 2002 - 2018 the average number of fire-related casualties per year is 0. The highest number of reported injuries - 1 took place in 2002, and the lowest - 0 in 2003. The data has a constant trend.
The average number of casualties per 1,000 fire incidents is 1. This indicator was the highest - 6 in 2013, and the lowest 0 in 2003. The trend for injuries per 1,000 fire incidents is declining. Compared to the state value the number of casualties per 1,000 fires is much lower.Casualties per 1,000 incidents in Sherwood, AR compared to nearest cities:
(Note: Based on data for all years, including only cities with at least 500 fire incidents)
| Sherwood: | 1.5 |
| North Little Rock: | 4.5 |
| Jacksonville: | 8.1 |
| Little Rock: | 9.9 |
| Maumelle: | 10.5 |
| Scott: | 0.0 |
| Cabot: | 1.1 |
| Mayflower: | 0.0 |
| Vilonia: | 2.3 |
 29.4% incidents where reported in the morning and 70.6% in the evening. The most fires (17.6%) took place on Saturday, and the least (12.2%) on Tuesday.
 According to the 2,694 reports from years 2002 - 2018 most fires (11.2%) took place during January, and the least (6.0%) in May.
 Out of all 20,108 cases reported during the years 2002 - 2018, the most belonged to the categories: Rescue & EMS (62.1%), Fire (13.4%), and Good Intent Call (6.5%).
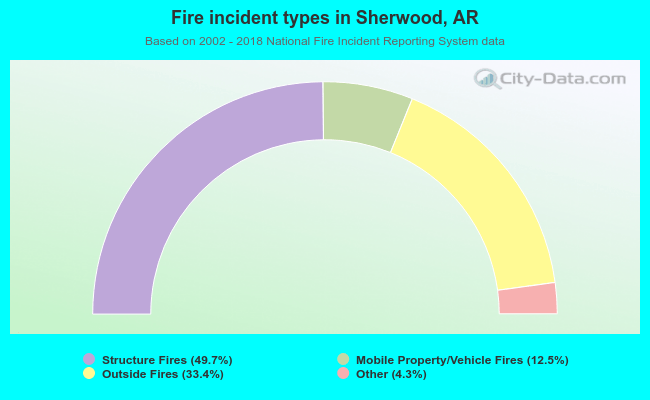 When looking into fire subcategories, the most incidents belonged to: Structure Fires (49.7%), and Outside Fires (33.4%).