Scott: Fire Incidents, Arkansas (AR)
Where are fire incidents reported in Scott, AR
Something went wrong! Please refresh the page.
|
| |||||||||||||||||||||||||||||||||||||||||||||||||||||||||||||||||||||||||||||||||||||||||||||||||||||||||||||
| Other | 47 | |||||||||||||||||||||||||||||||||||||||||||||||||||||||||||||||||||||||||||||||||||||||||||||||||||||||||||||
2002 - 2018 National Fire Incident Reporting System (NFIRS) incidents
- Incident types reported to NFIRS in Scott, AR
- 58151.9%Fire
- 28225.2%Rescue & EMS
- 1029.1%Good Intent Call
- 645.7%Hazardous Condition
- 353.1%Service Call
- 322.9%False Alarm
- 201.8%Severe Weather
- 20.2%Overpressure Rupture
- Fire incident types reported to NFIRS in Scott, AR
- 28749.4%Outside Fires
- 21036.1%Structure Fires
- 6611.4%Mobile Property/Vehicle Fires
- 183.1%Other
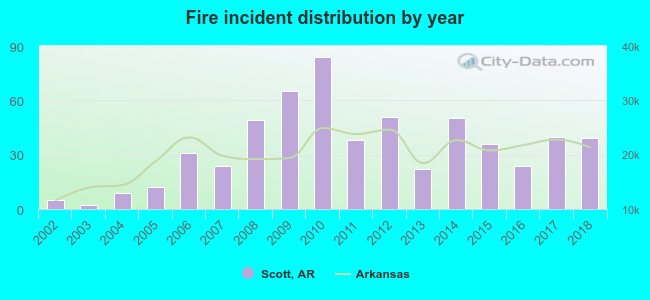 Based on the data from the years 2002 - 2018 the average number of fire incidents per year is 34. The highest number of reported fire incidents - 84 took place in 2010, and the least - 2 in 2003. The data has a rising trend.
 The median response time based on all reported fire incidents is 9 minutes. This is higher than the Arkansas median value.
The median response time in Scott, AR compared to nearest cities:
(Note: Based on data for all years, including only cities with at least 500 fire incidents)
| Scott: | 9 minutes |
| North Little Rock: | 5 minutes |
| Sherwood: | 4 minutes |
| Jacksonville: | 5 minutes |
| Lonoke: | 9 minutes |
| Little Rock: | 5 minutes |
| Hensley: | 10 minutes |
| Cabot: | 6 minutes |
| Alexander: | 9 minutes |
 According to the reports from the years 2002 - 2018 the average number of fire-related yearly deaths is 0. The highest number of deaths - 1 took place in 2004, and the lowest - 0 in 2002. The data has a constant trend.
 29.8% incidents where reported in the morning and 70.2% in the evening. The most fires (17.9%) took place on Saturday, and the least (12.0%) on Tuesday.
 According to the 581 fire incident reports from years 2002 - 2018 most fires (11.7%) took place during January, and the least (5.7%) in May.
 Out of all 1,119 cases reported during the years 2002 - 2018, the most belonged to the categories: Fire (51.9%), Rescue & EMS (25.2%), and Good Intent Call (9.1%).
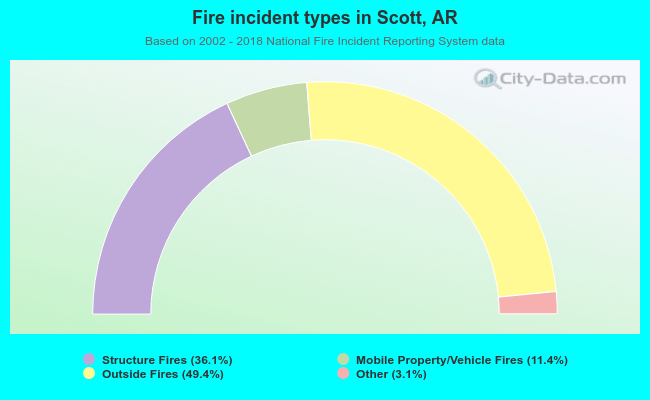 When looking into fire subcategories, the most incidents belonged to: Outside Fires (49.4%), and Structure Fires (36.1%).