| Fire incidents reported |
|---|
| Sreet name | Count |
|---|
| RUSSELL RD | 28 | | WORTHINGTON RD | 24 | | BASKET ST | 22 | | OLD CHESTER RD | 22 | | PISGAH RD | 20 | | GOSS HILL RD | 18 | | ALLEN COIT RD | 16 | | UPPER RUSSELL RD | 16 | | POND BROOK RD | 14 | | HAMBLIN CT | 12 | | MAIN ST | 12 | | BROMLEY RD | 10 | | COUNTY RD | 10 | | MAPLE ST | 10 | | NORWICH LAKE | 10 | | BAR HILL RD | 8 | | BLANDFORD HILL RD | 8 | | OUT OF TOWN | 8 | | RUSSELL RD | 8 | | SEARL RD | 8 | | SEARLES RD | 8 | | 47 OLD CHESTER RD | 6 | | BEAN HILL RD | 6 | | HARLO CLARK RD | 6 | | HARLOW CLARK RD | 6 |
| | | Fire incidents reported |
|---|
| Sreet name | Count |
|---|
| LOWELL LN | 6 | | MILL ST | 6 | | ROUTE 20 | 6 | | BARR HILL RD | 4 | | BASKET ST | 4 | | BIRCHWOOD DR | 4 | | BLANDFORD HILL RD | 4 | | CARRINGTON RD | 4 | | COUNTY RD | 4 | | EAST MAIN ST | 4 | | EAST MAIN ST | 4 | | HUNTINGTON RD | 4 | | KNIGHTVILLE DAM RD | 4 | | LAUREL RD | 4 | | LITTLEVILLE RD | 4 | | POND BROOK RD | 4 | | ROUTE 112 | 4 | | SAMPSON RD | 4 | | SEARLE RD | 4 | | STANTON AVE | 4 | | 0 RT 112 ROBERT CROSS BR | 2 | | 1 ARNOLD DR. | 2 | | 12 LITTLEVILLE RD | 2 | | 13 OLD CHESTER RD | 2 | | |
|
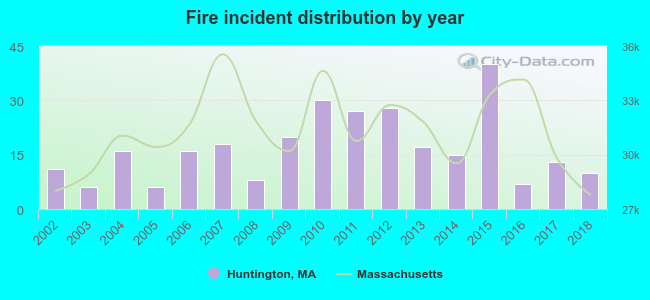 Based on the data from the years 2002 - 2018 the average number of fires per year is 17. The highest number of fires - 40 took place in 2015, and the least - 6 in 2003. The data has a decreasing trend.
 24.7% incidents where reported in the morning and 75.3% in the evening. The most fires (16.7%) took place on Sunday, and the least (12.8%) on Wednesday.
 According to the 288 fire incidents from years 2002 - 2018 most fires (20.5%) took place during April, and the least (3.5%) in June.
 Out of all 1,226 cases reported during the years 2002 - 2018, the most belonged to the categories: Rescue & EMS (41.4%), Fire (23.5%), and Hazardous Condition (20.9%).
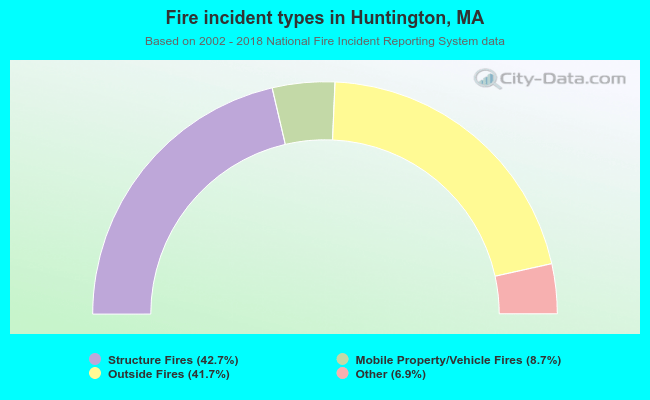 When looking into fire subcategories, the most incidents belonged to: Structure Fires (42.7%), and Outside Fires (41.7%).