Hutchinson: Fire Incidents, Kansas (KS)
Where are fire incidents reported in Hutchinson, KS
Something went wrong! Please refresh the page.
| Fire incidents reported | |
|---|---|
| Sreet name | Count |
| 4 AVE | 472 |
| MAIN ST | 358 |
| PLUM ST | 240 |
| 11 AVE | 222 |
| 30 AVE | 222 |
| 17 AVE | 208 |
| 1 AVE | 198 |
| LORRAINE ST | 196 |
| A AVE | 186 |
| 5 AVE | 184 |
| 2 AVE | 182 |
| MONROE ST | 178 |
| 6 AVE | 166 |
| HALSTEAD ST | 154 |
| SHERMAN AVE | 150 |
| G AVE | 140 |
| 3 AVE | 136 |
| 43 AVE | 134 |
| 7 AVE | 134 |
| 9 AVE | 132 |
| 56 AVE | 120 |
| BLANCHARD AVE | 106 |
| B AVE | 104 |
| 10 AVE | 96 |
| 8 AVE | 92 |
| MAYFIELD RD | 86 |
| 69 AVE | 84 |
| 23 AVE | 74 |
| 95 AVE | 72 |
| OBEE RD | 72 |
| Other | 385 |
2002 - 2018 National Fire Incident Reporting System (NFIRS) incidents
- Incident types reported to NFIRS in Hutchinson, KS
- 16,29650.3%Rescue & EMS
- 5,28316.3%Fire
- 4,31213.3%Hazardous Condition
- 2,7818.6%Good Intent Call
- 2,1326.6%Service Call
- 1,3304.1%False Alarm
- 2110.7%Special Incident
- 480.1%Overpressure Rupture
- Fire incident types reported to NFIRS in Hutchinson, KS
- 2,80953.2%Outside Fires
- 1,64831.2%Structure Fires
- 75314.3%Mobile Property/Vehicle Fires
- 731.4%Other
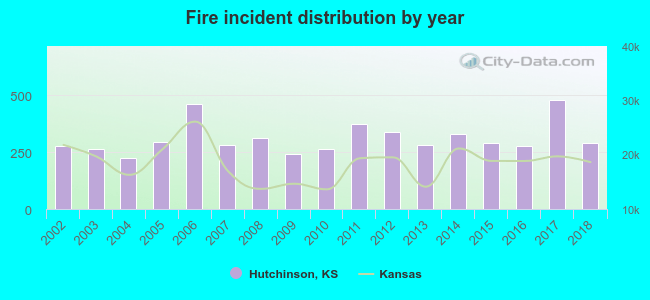 According to the data from the years 2002 - 2018 the average number of fire incidents per year is 311. The highest number of fires - 478 took place in 2017, and the least - 226 in 2004. The data has a rising trend.
The average number of yearly fire incidents per 10k residents in Hutchinson, KS compared to nearest cities:
(Note: Based on data for the last 3 years, including only cities with population 5,000 and above)
| Hutchinson: | 83.9 |
| McPherson: | 61.2 |
| Newton: | 59.3 |
| Valley Center: | 119.5 |
| Park City: | 41.9 |
| Wichita: | 48.0 |
| Bel Aire: | 17.4 |
| Haysville: | 53.7 |
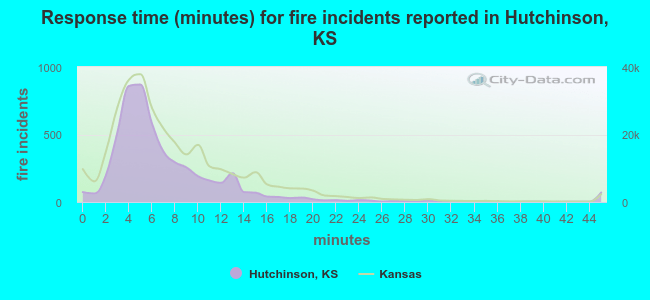 The median response time based on all reported fire incidents is 6 minutes. This is close to the state median value.
The median response time in Hutchinson, KS compared to nearest cities:
(Note: Based on data for all years, including only cities with at least 500 fire incidents)
| Hutchinson: | 6 minutes |
| Inman: | 10 minutes |
| Halstead: | 6 minutes |
| McPherson: | 5 minutes |
| Kingman: | 9 minutes |
| Cheney: | 10 minutes |
| Newton: | 7 minutes |
| Goddard: | 7 minutes |
| Valley Center: | 8 minutes |
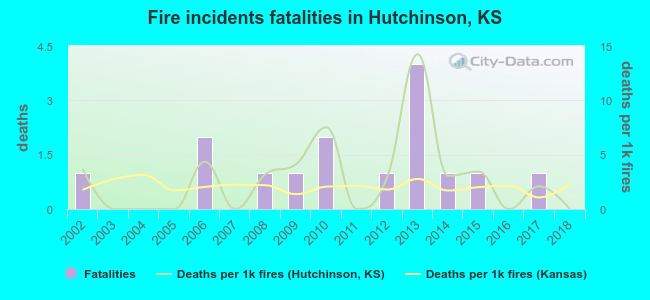 According to the data from the years 2002 - 2018 the average number of fire-related fatalities per year is 1. The highest number of reported deaths - 4 took place in 2013, and the lowest - 0 in 2003. The data has a declining trend.
The average number of fatalities per 1,000 fire incidents is 3. This indicator was the highest - 14 in 2013, and the lowest 0 in 2003. The trend for fatalities per 1,000 fire incidents is dropping. Compared to the Kansas value the number of deaths per 1,000 fire incidents is higher.
According to the data from the years 2002 - 2018 the average number of fire-related fatalities per year is 1. The highest number of reported deaths - 4 took place in 2013, and the lowest - 0 in 2003. The data has a declining trend.
The average number of fatalities per 1,000 fire incidents is 3. This indicator was the highest - 14 in 2013, and the lowest 0 in 2003. The trend for fatalities per 1,000 fire incidents is dropping. Compared to the Kansas value the number of deaths per 1,000 fire incidents is higher.Deaths per 1,000 incidents in Hutchinson, KS compared to nearest cities:
(Note: Based on data for all years, including only cities with at least 2,500 fire incidents)
| Hutchinson: | 2.8 |
| Wichita: | 2.6 |
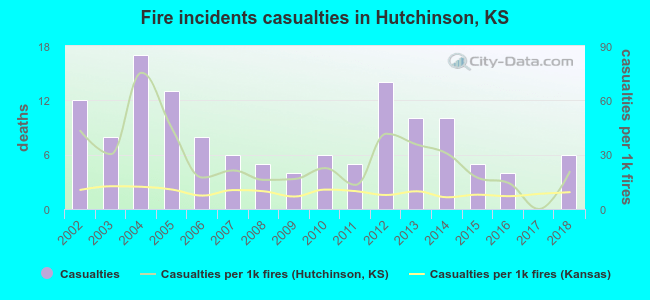 Based on the reports from the years 2002 - 2018 the average number of fire-related yearly casualties is 8. The highest number of casualties - 17 took place in 2004, and the lowest - 0 in 2017. The data has a dropping trend.
The average number of injuries per 1,000 fires is 27. This indicator was the highest - 75 in 2004, and the lowest 0 in 2017. The trend for casualties per 1,000 fires is dropping. Compared to the Kansas value the number of casualties per 1,000 fires is much higher.
Based on the reports from the years 2002 - 2018 the average number of fire-related yearly casualties is 8. The highest number of casualties - 17 took place in 2004, and the lowest - 0 in 2017. The data has a dropping trend.
The average number of injuries per 1,000 fires is 27. This indicator was the highest - 75 in 2004, and the lowest 0 in 2017. The trend for casualties per 1,000 fires is dropping. Compared to the Kansas value the number of casualties per 1,000 fires is much higher.
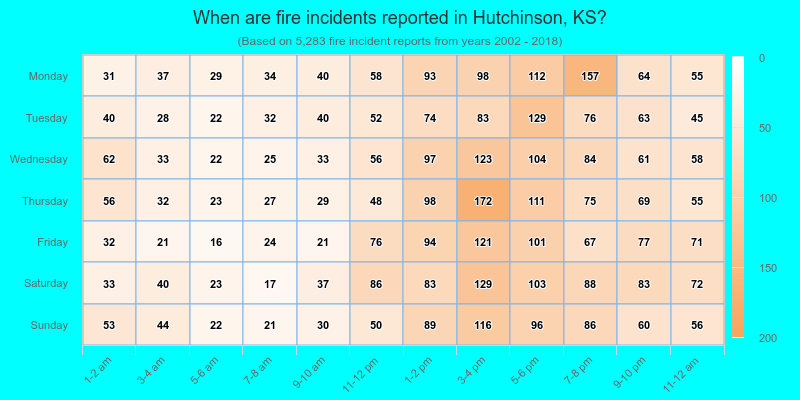
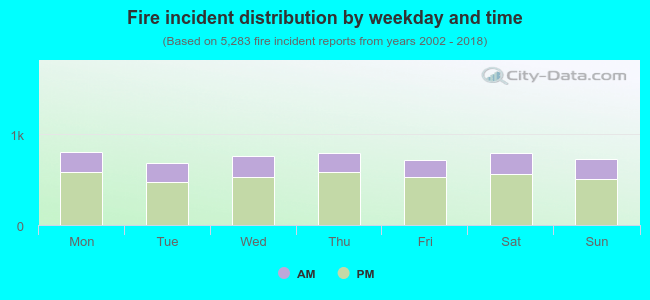 29.1% incidents where reported in the morning and 70.9% in the evening. The most fires (15.3%) took place on Monday, and the least (12.9%) on Tuesday.
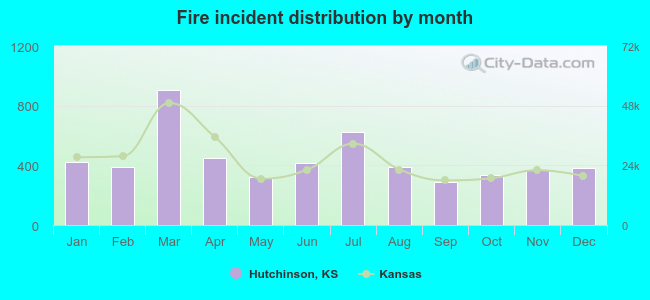 Based on the 5,283 fire incidents from years 2002 - 2018 most fires (17.1%) took place during March, and the least (5.4%) in September.
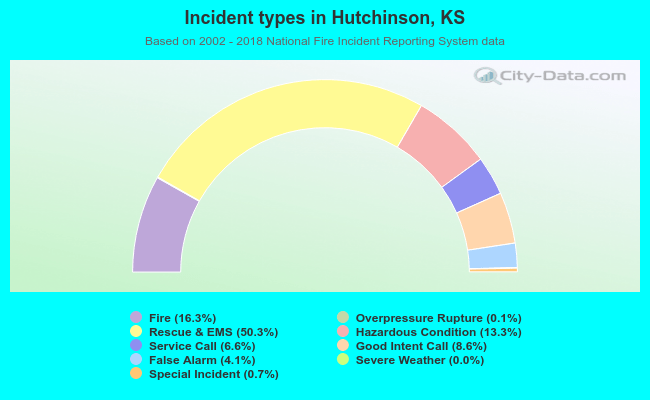 Out of all 32,409 cases reported during the years 2002 - 2018, the most belonged to the categories: Rescue & EMS (50.3%), Fire (16.3%), and Hazardous Condition (13.3%).
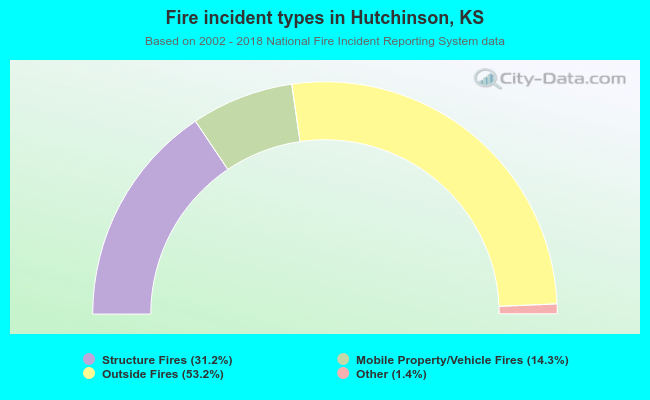 When looking into fire subcategories, the most incidents belonged to: Outside Fires (53.2%), and Structure Fires (31.2%).