Wichita: Fire Incidents, Kansas (KS)
Where are fire incidents reported in Wichita, KS
Something went wrong! Please refresh the page.
| Fire incidents reported | |
|---|---|
| Sreet name | Count |
| 21ST ST | 1,094 |
| HARRY ST | 1,020 |
| 13TH ST | 1,008 |
| KELLOGG DR | 892 |
| ROCK RD | 842 |
| SENECA ST | 696 |
| BROADWAY AV | 606 |
| CENTRAL AV | 564 |
| WEST ST | 532 |
| MARKET ST | 514 |
| 37TH ST | 500 |
| 47TH ST | 500 |
| MACARTHUR RD | 468 |
| RIDGE RD | 460 |
| 29TH ST | 452 |
| LINCOLN ST | 442 |
| DOUGLAS AV | 426 |
| HYDRAULIC AV | 406 |
| PAWNEE AV | 388 |
| 31ST ST | 386 |
| MAIN ST | 380 |
| WEBB RD | 374 |
| KELLOGG ST | 368 |
| BROADWAY AVE | 352 |
| MAC ARTHUR RD | 348 |
| TYLER RD | 344 |
| MAIZE RD | 330 |
| MAPLE ST | 328 |
| GREENWICH RD | 310 |
| 55TH ST | 308 |
| Other | 16,004 |
2002 - 2018 National Fire Incident Reporting System (NFIRS) incidents
- Incident types reported to NFIRS in Wichita, KS
- 206,82062.2%Rescue & EMS
- 35,27810.6%Good Intent Call
- 31,6429.5%Fire
- 24,2927.3%Service Call
- 20,7576.2%Hazardous Condition
- 12,0483.6%False Alarm
- 6600.2%Special Incident
- 6180.2%Overpressure Rupture
- Fire incident types reported to NFIRS in Wichita, KS
- 13,63543.1%Outside Fires
- 12,45339.4%Structure Fires
- 5,35216.9%Mobile Property/Vehicle Fires
- 2020.6%Other
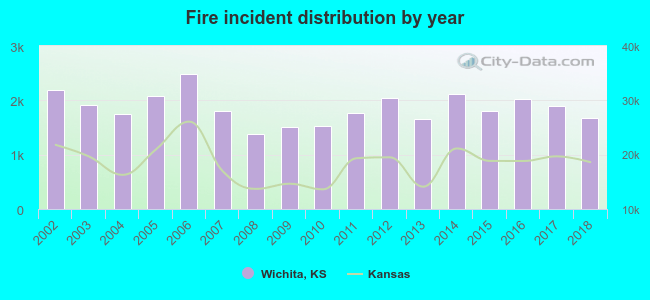 According to the data from the years 2002 - 2018 the average number of fires per year is 1,861. The highest number of reported fire incidents - 2,478 took place in 2006, and the least - 1,379 in 2008. The data has a decreasing trend.
The average number of yearly fire incidents per 10k residents in Wichita, KS compared to nearest cities:
(Note: Based on data for the last 3 years, including only cities with population 5,000 and above)
| Wichita: | 48.0 |
| Bel Aire: | 17.4 |
| Park City: | 41.9 |
| Haysville: | 53.7 |
| Valley Center: | 119.5 |
| Derby: | 66.0 |
| Andover: | 51.4 |
| Mulvane: | 130.9 |
| Augusta: | 154.4 |
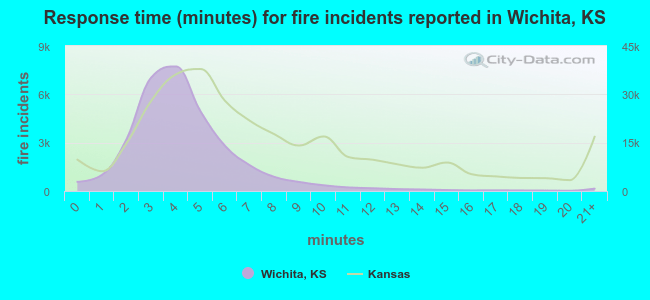 The median response time based on all reported fire incidents is 4 minutes. This is lower compared to the state median value.
The median response time in Wichita, KS compared to nearest cities:
(Note: Based on data for all years, including only cities with at least 500 fire incidents)
| Wichita: | 4 minutes |
| Haysville: | 6 minutes |
| Valley Center: | 8 minutes |
| Derby: | 5 minutes |
| Andover: | 5 minutes |
| Goddard: | 7 minutes |
| Rose Hill: | 7 minutes |
| Benton: | 10 minutes |
| Mulvane: | 7 minutes |
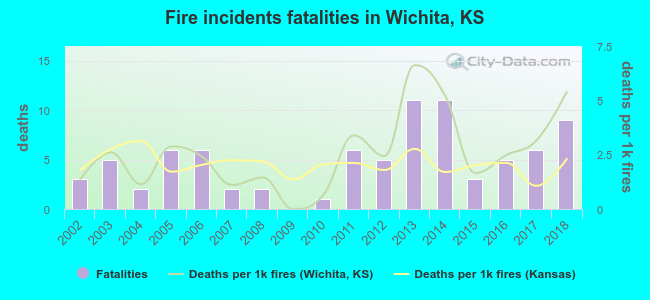 Based on the reports from the years 2002 - 2018 the average number of fire-related yearly deaths is 5. The highest number of reported deaths - 11 took place in 2013, and the lowest - 0 in 2009. The data has a rising trend.
The average number of fatalities per 1,000 fires is 3. This indicator was the highest - 7 in 2013, and the lowest 0 in 2009. The trend for fatalities per 1,000 incidents is rising. Compared to the state value the number of fatalities per 1,000 incidents is higher.
Based on the reports from the years 2002 - 2018 the average number of fire-related yearly deaths is 5. The highest number of reported deaths - 11 took place in 2013, and the lowest - 0 in 2009. The data has a rising trend.
The average number of fatalities per 1,000 fires is 3. This indicator was the highest - 7 in 2013, and the lowest 0 in 2009. The trend for fatalities per 1,000 incidents is rising. Compared to the state value the number of fatalities per 1,000 incidents is higher.Deaths per 1,000 incidents in Wichita, KS compared to nearest cities:
(Note: Based on data for all years, including only cities with at least 2,500 fire incidents)
| Wichita: | 2.6 |
| El Dorado: | 1.6 |
| Hutchinson: | 2.8 |
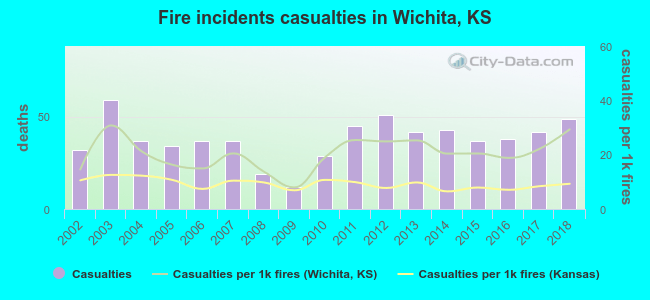 Based on the data from the years 2002 - 2018 the average number of fire-related yearly casualties is 38. The highest number of reported injuries - 59 took place in 2003, and the lowest - 12 in 2009. The data has an increasing trend.
The average number of injuries per 1,000 fires is 20. This indicator was the highest - 31 in 2003, and the lowest 8 in 2009. The trend for injuries per 1,000 incidents is rising. Compared to the state value the number of injuries per 1,000 fire incidents is much higher.
Based on the data from the years 2002 - 2018 the average number of fire-related yearly casualties is 38. The highest number of reported injuries - 59 took place in 2003, and the lowest - 12 in 2009. The data has an increasing trend.
The average number of injuries per 1,000 fires is 20. This indicator was the highest - 31 in 2003, and the lowest 8 in 2009. The trend for injuries per 1,000 incidents is rising. Compared to the state value the number of injuries per 1,000 fire incidents is much higher.
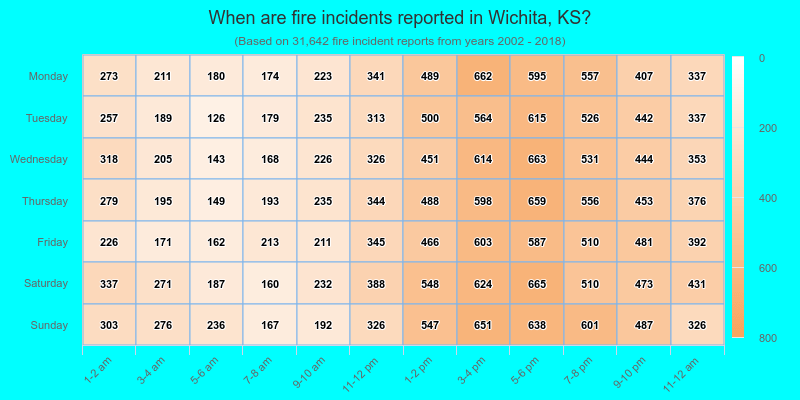
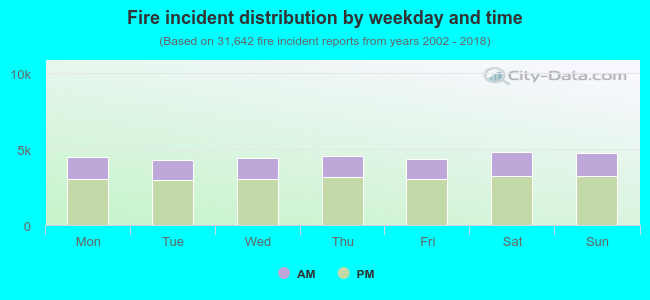 31.2% incidents where reported in the morning and 68.8% in the evening. The most fires (15.3%) took place on Saturday, and the least (13.5%) on Tuesday.
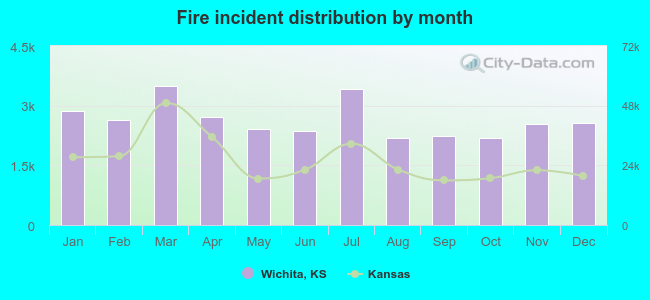 Based on the 31,642 reports from years 2002 - 2018 most fires (11.0%) took place during March, and the least (6.9%) in October.
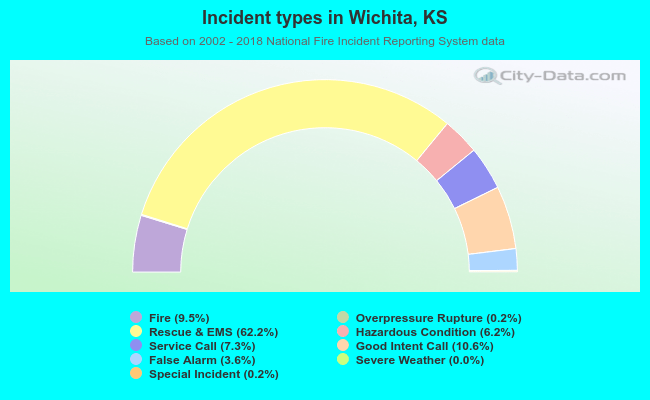 Out of all 332,259 cases reported during the years 2002 - 2018, the most belonged to the categories: Rescue & EMS (62.2%), Good Intent Call (10.6%), and Fire (9.5%).
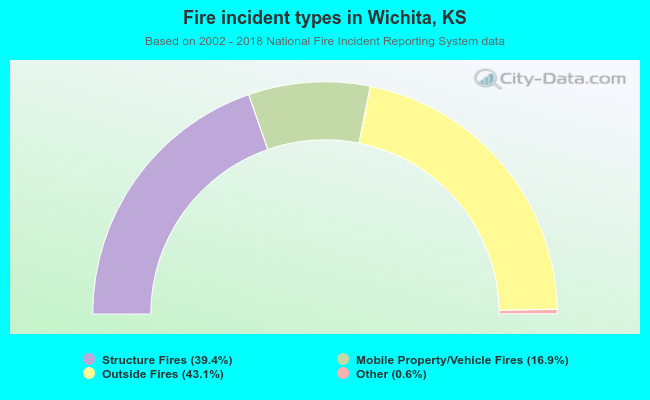 When looking into fire subcategories, the most reports belonged to: Outside Fires (43.1%), and Structure Fires (39.4%).