Islip Terrace: Fire Incidents, New York (NY)
Where are fire incidents reported in Islip Terrace, NY
Something went wrong! Please refresh the page.
|
| |||||||||||||||||||||||||||||||||||||||||||||||||||||||||||||||||||||||||||||||||||||||||||||||||||||||||||||
2003 - 2018 National Fire Incident Reporting System (NFIRS) incidents
- Incident types reported to NFIRS in Islip Terrace, NY
- 86347.5%Rescue & EMS
- 31317.2%Hazardous Condition
- 23512.9%Fire
- 1598.8%False Alarm
- 1578.6%Good Intent Call
- 633.5%Service Call
- 130.7%Severe Weather
- 120.7%Special Incident
- Fire incident types reported to NFIRS in Islip Terrace, NY
- 10042.6%Structure Fires
- 7632.3%Outside Fires
- 4017.0%Mobile Property/Vehicle Fires
- 198.1%Other
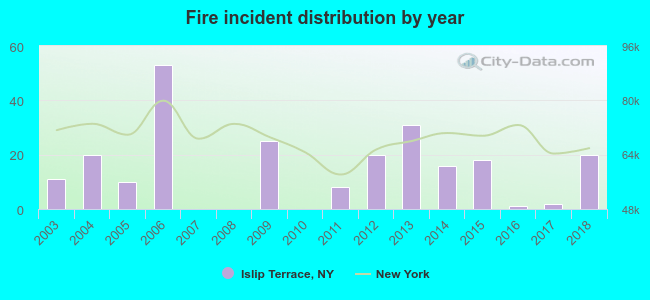 Based on the data from the years 2003 - 2018 the average number of fire incidents per year is 15. The highest number of fires - 53 took place in 2006, and the least - 0 in 2007. The data has a rising trend.
The average number of yearly fire incidents per 10k residents in Islip Terrace, NY compared to nearest cities:
(Note: Based on data for the last 3 years, including only cities with population 5,000 and above)
| Islip Terrace: | 14.2 |
| East Islip: | 6.9 |
| Islip: | 4.0 |
| Oakdale: | 31.4 |
| Central Islip: | 27.4 |
| Bay Shore: | 44.6 |
| Brentwood: | 21.8 |
| Bohemia: | 32.1 |
| West Sayville: | 19.3 |

 29.4% incidents where reported in the morning and 70.6% in the evening. The most fires (17.4%) took place on Saturday, and the least (11.1%) on Wednesday.
 Based on the 235 fire incident reports from years 2003 - 2018 most fires (11.9%) took place during July, and the least (5.5%) in October.
 Out of all 1,816 cases reported during the years 2003 - 2018, the most belonged to the categories: Rescue & EMS (47.5%), Hazardous Condition (17.2%), and Fire (12.9%).
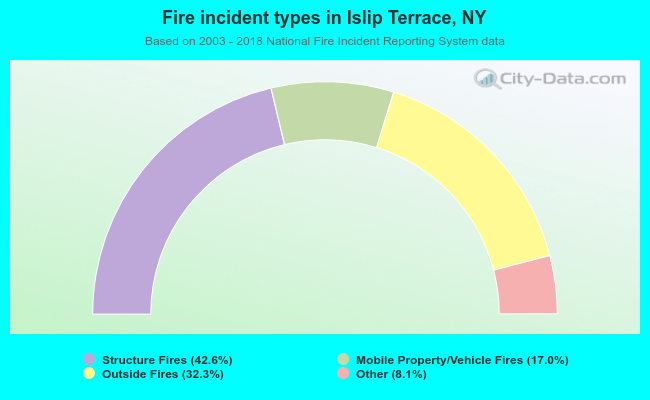 When looking into fire subcategories, the most incidents belonged to: Structure Fires (42.6%), and Outside Fires (32.3%).