Oakdale: Fire Incidents, New York (NY)
Where are fire incidents reported in Oakdale, NY
Something went wrong! Please refresh the page.
|
| |||||||||||||||||||||||||||||||||||||||||||||||||||||||||||||||||||||||||||||||||||||||||||||||||||||||||||||
2002 - 2018 National Fire Incident Reporting System (NFIRS) incidents
- Incident types reported to NFIRS in Oakdale, NY
- 80535.5%False Alarm
- 46220.4%Hazardous Condition
- 35715.8%Fire
- 33014.6%Rescue & EMS
- 1587.0%Good Intent Call
- 1426.3%Service Call
- 70.3%Overpressure Rupture
- 30.1%Severe Weather
- Fire incident types reported to NFIRS in Oakdale, NY
- 14540.6%Structure Fires
- 13638.1%Outside Fires
- 6317.6%Mobile Property/Vehicle Fires
- 133.6%Other
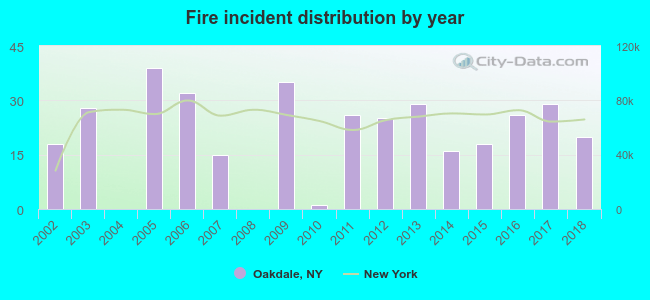 According to the data from the years 2002 - 2018 the average number of fire incidents per year is 21. The highest number of reported fires - 39 took place in 2005, and the least - 0 in 2004. The data has an increasing trend.
The average number of yearly fire incidents per 10k residents in Oakdale, NY compared to nearest cities:
(Note: Based on data for the last 3 years, including only cities with population 5,000 and above)
| Oakdale: | 31.4 |
| West Sayville: | 19.3 |
| East Islip: | 6.9 |
| Bohemia: | 32.1 |
| Islip Terrace: | 14.2 |
| Sayville: | 13.4 |
| Islip: | 4.0 |
| Central Islip: | 27.4 |
| Bayport: | 7.1 |

 28.6% incidents where reported in the morning and 71.4% in the evening. The most fires (19.0%) took place on Sunday, and the least (10.6%) on Monday.
 Based on the 357 reports from years 2002 - 2018 most fires (12.3%) took place during April, and the least (6.4%) in May.
 Out of all 2,265 cases reported during the years 2002 - 2018, the most belonged to the categories: False Alarm (35.5%), Hazardous Condition (20.4%), and Fire (15.8%).
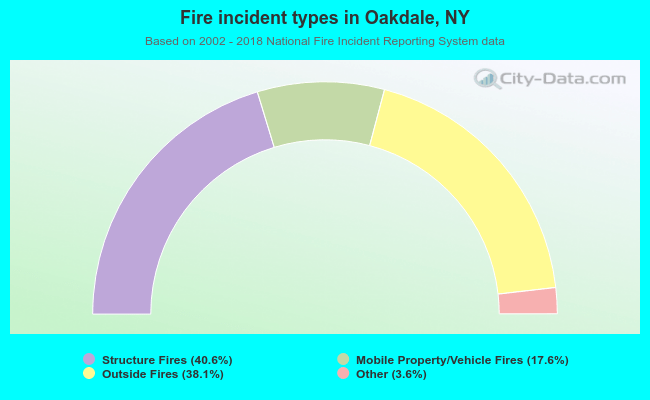 When looking into fire subcategories, the most incidents belonged to: Structure Fires (40.6%), and Outside Fires (38.1%).