| Fire incidents reported |
|---|
| Sreet name | Count |
|---|
| HIGHWAY 18 | 56 | | ORLA HIGHWAY | 36 | | NORTH HIGHWAY 18 | 20 | | C1 | 18 | | COUNTRY CLUB ROAD | 16 | | DOLLARHIDE ROAD | 16 | | BATTLE AX ROAD | 14 | | BATTLE AXE ROAD | 14 | | DEEP WELLS ROAD | 14 | | EAST HIGHWAY 128 | 14 | | SID RICHARDSON ROAD | 14 | | WILLIS ROAD | 14 | | HIGHWAY 128 | 12 | | NORTH WILLIS ROAD | 12 | | SOUTH HIGHWAY 18 | 12 | | WEST HIGHWAY 128 | 12 | | C2 | 10 | | EAST 128 | 10 | | HIGHWAY 18 MM11 | 10 | | NORTH 18 | 10 | | W HWY 128 | 10 | | WEST 128 | 10 | | BRININSTOOL ROAD | 8 | | DELAWARE BASIN ROAD | 8 | | HIGHWAY 18 MM6 | 8 |
| | | Fire incidents reported |
|---|
| Sreet name | Count |
|---|
| MONSANTO ROAD | 8 | | NORTH HWY 18 | 8 | | ALAMEDA STREET | 6 | | COOPER CEMETARY ROAD | 6 | | DIAMOND ROAD | 6 | | ST HWY 128 | 6 | | TEAGUE SWITCH ROAD | 6 | | WEST HWY 128 | 6 | | WHITWORTH DRIVE | 6 | | XL ROAD | 6 | | 123 N 6TH STREET | 4 | | 3 MILES EAST ON 128 | 4 | | 436 SOUTH 5TH | 4 | | COOPER CEMENTARY ROAD | 4 | | COUNTY ROAD 1 | 4 | | CRAWFORD ROAD | 4 | | DELAWARE BASIN | 4 | | EAST 128 AND DOLLARHIDE ROAD | 4 | | EAST MERRYMAN | 4 | | EAST MERRYMAN DRIVE | 4 | | FRYING PAN ROAD | 4 | | HIGHWAY 128 AND DELAWARE BASIN | 4 | | HIGHWAY 128 MM 47 | 4 | | HIGHWAY 128 MM57 | 4 | | |
|
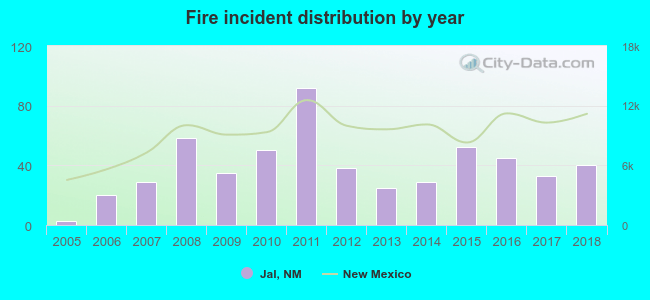 Based on the data from the years 2005 - 2018 the average number of fires per year is 39. The highest number of fire incidents - 92 took place in 2011, and the least - 3 in 2005. The data has an increasing trend.
 The median response time based on all reported fire incidents is 15 minutes. This is higher compared to the New Mexico median value.
 28.1% incidents where reported in the morning and 71.9% in the evening. The most fires (18.2%) took place on Friday, and the least (11.7%) on Thursday.
 According to the 549 incident reports from years 2005 - 2018 most fires (13.3%) took place during June, and the least (4.6%) in October.
 Out of all 983 cases reported during the years 2005 - 2018, the most belonged to the categories: Fire (55.8%), Rescue & EMS (25.2%), and Overpressure Rupture (8.1%).
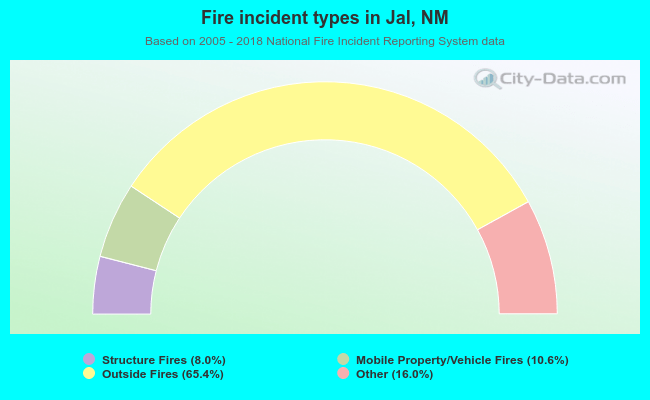 When looking into fire subcategories, the most incidents belonged to: Outside Fires (65.4%), and Other (16.0%).