Lovington: Fire Incidents, New Mexico (NM)
Where are fire incidents reported in Lovington, NM
Something went wrong! Please refresh the page.
|
| |||||||||||||||||||||||||||||||||||||||||||||||||||||||||||||||||||||||||||||||||||||||||||||||||||||||||||||
| Other | 457 | |||||||||||||||||||||||||||||||||||||||||||||||||||||||||||||||||||||||||||||||||||||||||||||||||||||||||||||
2002 - 2018 National Fire Incident Reporting System (NFIRS) incidents
- Incident types reported to NFIRS in Lovington, NM
- 1,24553.5%Fire
- 53523.0%Service Call
- 29312.6%Hazardous Condition
- 1757.5%False Alarm
- 441.9%Good Intent Call
- 210.9%Rescue & EMS
- 120.5%Special Incident
- 40.2%Overpressure Rupture
- Fire incident types reported to NFIRS in Lovington, NM
- 77662.3%Outside Fires
- 19115.3%Other
- 18014.5%Structure Fires
- 987.9%Mobile Property/Vehicle Fires
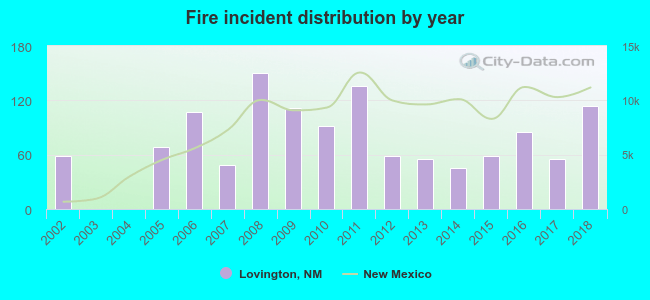 According to the data from the years 2002 - 2018 the average number of fire incidents per year is 73. The highest number of reported fire incidents - 150 took place in 2008, and the least - 0 in 2003. The data has a growing trend.
 The median response time based on all reported fire incidents is 7 minutes. This is close to the New Mexico median value.
 32.9% incidents where reported in the morning and 67.1% in the evening. The most fires (15.9%) took place on Wednesday, and the least (13.0%) on Monday.
 Based on the 1,245 incident reports from years 2002 - 2018 most fires (12.4%) took place during March, and the least (3.5%) in September.
 Out of all 2,329 cases reported during the years 2002 - 2018, the most belonged to the categories: Fire (53.5%), Service Call (23.0%), and Hazardous Condition (12.6%).
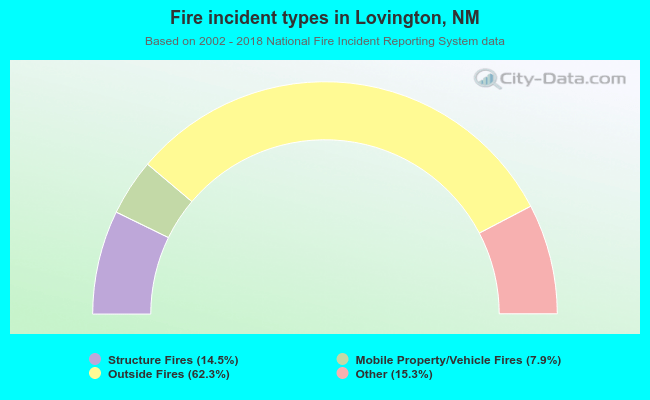 When looking into fire subcategories, the most reports belonged to: Outside Fires (62.3%), and Other (15.3%).