Roswell: Fire Incidents, New Mexico (NM)
Where are fire incidents reported in Roswell, NM
Something went wrong! Please refresh the page.
| Fire incidents reported | |
|---|---|
| Sreet name | Count |
| MAIN ST | 478 |
| MAIN | 164 |
| GARDEN AVE | 160 |
| ATKINSON AVE | 158 |
| UNION AVE | 146 |
| MCGAFFEY ST | 142 |
| 2ND ST | 130 |
| LEA AVE | 128 |
| HENDRICKS ST | 122 |
| WASHINGTON AVE | 104 |
| ALAMEDA ST | 102 |
| SUNSET AVE | 102 |
| COLLEGE BLVD | 100 |
| TILDEN ST | 98 |
| COUNTRY CLUB RD | 96 |
| PINE LODGE RD | 94 |
| PENNSYLVANIA AVE | 92 |
| BLAND ST | 80 |
| DEMING ST | 80 |
| MICHIGAN AVE | 80 |
| SUMMIT ST | 78 |
| ALBUQUERQUE ST | 76 |
| BROWN RD | 76 |
| HOBSON RD | 76 |
| BRASHER RD | 74 |
| KENTUCKY AVE | 74 |
| KANSAS AVE | 72 |
| MISSOURI AVE | 72 |
| WYOMING AVE | 70 |
| RICHARDSON AVE | 66 |
| Other | 1,794 |
2004 - 2018 National Fire Incident Reporting System (NFIRS) incidents
- Incident types reported to NFIRS in Roswell, NM
- 5,18453.4%Fire
- 1,67317.2%False Alarm
- 1,51215.6%Hazardous Condition
- 5625.8%Good Intent Call
- 5185.3%Service Call
- 1481.5%Rescue & EMS
- 580.6%Special Incident
- 310.3%Overpressure Rupture
- 140.1%Severe Weather
- Fire incident types reported to NFIRS in Roswell, NM
- 2,99757.8%Outside Fires
- 1,03119.9%Structure Fires
- 63112.2%Other
- 52510.1%Mobile Property/Vehicle Fires
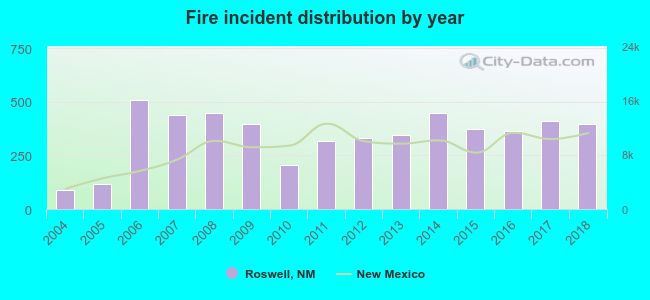 Based on the data from the years 2004 - 2018 the average number of fires per year is 346. The highest number of fires - 507 took place in 2006, and the least - 87 in 2004. The data has a growing trend.
The average number of yearly fire incidents per 10k residents in Roswell, NM compared to nearest cities:
(Note: Based on data for the last 3 years, including only cities with population 5,000 and above)
| Roswell: | 80.2 |
| Artesia: | 126.7 |
| Ruidoso: | 53.3 |
| Carlsbad: | 79.2 |
| Lovington: | 71.5 |
| Portales: | 111.7 |
| Alamogordo: | 39.8 |
| Hobbs: | 55.9 |
| Clovis: | 60.6 |
 The median response time based on all reported fire incidents is 5 minutes. This is lower than the state median value.
The median response time in Roswell, NM compared to nearest cities:
(Note: Based on data for all years, including only cities with at least 500 fire incidents)
| Roswell: | 5 minutes |
| Artesia: | 6 minutes |
| Carlsbad: | 5 minutes |
| Lovington: | 7 minutes |
| Portales: | 7 minutes |
| Alamogordo: | 5 minutes |
| Hobbs: | 5 minutes |
| Eunice: | 11 minutes |
| Clovis: | 5 minutes |
 Based on the data from the years 2004 - 2018 the average number of fire-related fatalities per year is 1. The highest number of reported deaths - 4 took place in 2011, and the lowest - 0 in 2004. The data has a rising trend.
The average number of fatalities per 1,000 fire incidents is 3. This indicator was the highest - 15 in 2010, and the lowest 0 in 2004. The trend for deaths per 1,000 fires is rising. Compared to the state value the number of deaths per 1,000 fires is higher.
Based on the data from the years 2004 - 2018 the average number of fire-related fatalities per year is 1. The highest number of reported deaths - 4 took place in 2011, and the lowest - 0 in 2004. The data has a rising trend.
The average number of fatalities per 1,000 fire incidents is 3. This indicator was the highest - 15 in 2010, and the lowest 0 in 2004. The trend for deaths per 1,000 fires is rising. Compared to the state value the number of deaths per 1,000 fires is higher.
 According to the data from the years 2004 - 2018 the average number of fire-related casualties per year is 1. The highest number of reported injuries - 4 took place in 2018, and the lowest - 0 in 2004. The data has an increasing trend.
The average number of injuries per 1,000 fire incidents is 1. This indicator was the highest - 10 in 2018, and the lowest 0 in 2004. The trend for casualties per 1,000 incidents is growing. Compared to the state value the number of casualties per 1,000 fire incidents is lower.
According to the data from the years 2004 - 2018 the average number of fire-related casualties per year is 1. The highest number of reported injuries - 4 took place in 2018, and the lowest - 0 in 2004. The data has an increasing trend.
The average number of injuries per 1,000 fire incidents is 1. This indicator was the highest - 10 in 2018, and the lowest 0 in 2004. The trend for casualties per 1,000 incidents is growing. Compared to the state value the number of casualties per 1,000 fire incidents is lower.
 30.4% incidents where reported in the morning and 69.6% in the evening. The most fires (15.1%) took place on Saturday, and the least (13.0%) on Tuesday.
 According to the 5,184 fire incident reports from years 2004 - 2018 most fires (10.6%) took place during March, and the least (6.4%) in October.
 Out of all 9,700 cases reported during the years 2004 - 2018, the most belonged to the categories: Fire (53.4%), False Alarm (17.2%), and Hazardous Condition (15.6%).
 When looking into fire subcategories, the most reports belonged to: Outside Fires (57.8%), and Structure Fires (19.9%).