Jasper: Fire Incidents, Alabama (AL)
Where are fire incidents reported in Jasper, AL
Something went wrong! Please refresh the page.
|
| |||||||||||||||||||||||||||||||||||||||||||||||||||||||||||||||||||||||||||||||||||||||||||||||||||||||||||||
2002 - 2018 National Fire Incident Reporting System (NFIRS) incidents
- Incident types reported to NFIRS in Jasper, AL
- 2,56245.1%Rescue & EMS
- 2,12237.3%Fire
- 5609.9%Hazardous Condition
- 1552.7%Service Call
- 1332.3%False Alarm
- 1272.2%Good Intent Call
- 140.2%Severe Weather
- 90.2%Special Incident
- Fire incident types reported to NFIRS in Jasper, AL
- 94044.3%Outside Fires
- 85640.3%Structure Fires
- 25111.8%Mobile Property/Vehicle Fires
- 753.5%Other
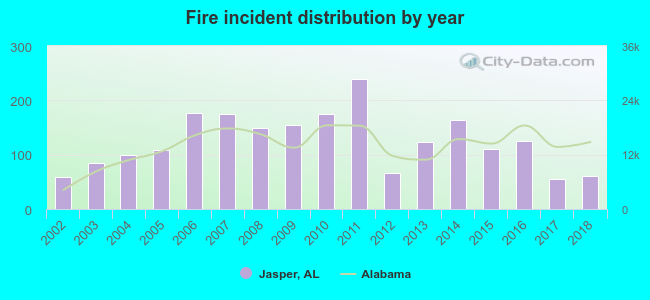 Based on the data from the years 2002 - 2018 the average number of fires per year is 125. The highest number of reported fire incidents - 240 took place in 2011, and the least - 56 in 2017. The data has a rising trend.
The average number of yearly fire incidents per 10k residents in Jasper, AL compared to nearest cities:
(Note: Based on data for the last 3 years, including only cities with population 5,000 and above)
| Jasper: | 56.9 |
| Bremen: | 4.7 |
| Gardendale: | 48.3 |
| Pleasant Grove: | 30.3 |
| Fultondale: | 48.3 |
| Hueytown: | 27.8 |
| Fairfield: | 8.2 |
| Midfield: | 63.3 |
| Cullman: | 83.0 |
 The median response time based on all reported fire incidents is 9 minutes. This is higher than the state median value.
The median response time in Jasper, AL compared to nearest cities:
(Note: Based on data for all years, including only cities with at least 500 fire incidents)
| Jasper: | 9 minutes |
| Parrish: | 10 minutes |
| Sumiton: | 5 minutes |
| Nauvoo: | 11 minutes |
| Adamsville: | 5 minutes |
| Pleasant Grove: | 4 minutes |
| Hayden: | 13 minutes |
| Haleyville: | 6 minutes |
| Midfield: | 5 minutes |
 32.6% incidents where reported in the morning and 67.4% in the evening. The most fires (17.3%) took place on Saturday, and the least (12.7%) on Tuesday.
 Based on the 2,122 fire incidents from years 2002 - 2018 most fires (12.4%) took place during March, and the least (4.9%) in August.
 Out of all 5,682 cases reported during the years 2002 - 2018, the most belonged to the categories: Overpressure Rupture (45.1%), Fire (37.3%), and Rescue & EMS (9.9%).
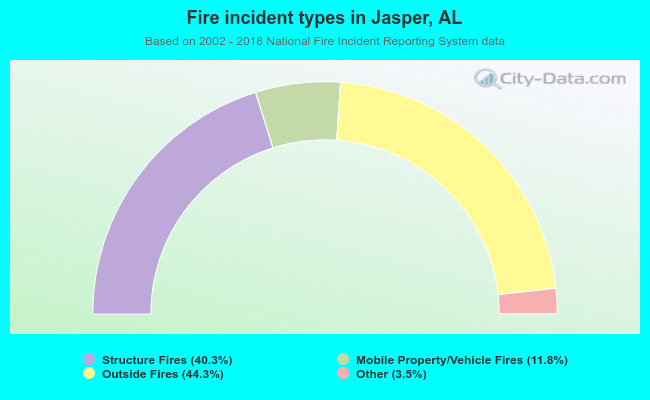 When looking into fire subcategories, the most reports belonged to: Outside Fires (44.3%), and Structure Fires (40.3%).