Jersey Village: Fire Incidents, Texas (TX)
Where are fire incidents reported in Jersey Village, TX
Something went wrong! Please refresh the page.
|
| |||||||||||||||||||||||||||||||||||||||||||||||||||||||||||||||||||||||||||||||||||||||||||||||||||||||||||||
2002 - 2018 National Fire Incident Reporting System (NFIRS) incidents
- Incident types reported to NFIRS in Jersey Village, TX
- 2,98956.9%Rescue & EMS
- 58211.1%Hazardous Condition
- 55510.6%Service Call
- 4678.9%Fire
- 4228.0%Good Intent Call
- 2274.3%False Alarm
- 110.2%Overpressure Rupture
- Fire incident types reported to NFIRS in Jersey Village, TX
- 16134.5%Structure Fires
- 15332.8%Mobile Property/Vehicle Fires
- 14230.4%Outside Fires
- 112.4%Other
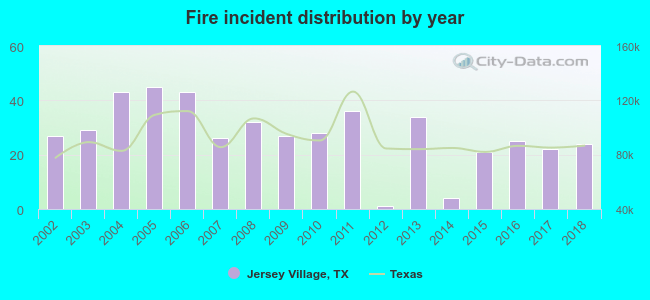 According to the data from the years 2002 - 2018 the average number of fires per year is 27. The highest number of reported fires - 45 took place in 2005, and the least - 1 in 2012. The data has a decreasing trend.
The average number of yearly fire incidents per 10k residents in Jersey Village, TX compared to nearest cities:
(Note: Based on data for the last 3 years, including only cities with population 5,000 and above)
| Jersey Village: | 29.9 |
| Aldine: | 1.6 |
| Houston: | 33.1 |
| Bellaire: | 17.9 |
| Tomball: | 209.2 |
| Spring: | 113.9 |
| Katy: | 260.2 |
| Meadows Place: | 2.9 |
| Stafford: | 75.0 |

 Based on the data from the years 2002 - 2018 the average number of fire-related yearly casualties is 1. The highest number of reported casualties - 4 took place in 2002, and the lowest - 0 in 2004. The data has a declining trend.
 27.8% incidents where reported in the morning and 72.2% in the evening. The most fires (15.8%) took place on Monday, and the least (13.1%) on Tuesday.
 Based on the 467 incident reports from years 2002 - 2018 most fires (10.9%) took place during March, and the least (5.8%) in February.
 Out of all 5,257 cases reported during the years 2002 - 2018, the most belonged to the categories: Rescue & EMS (56.9%), Hazardous Condition (11.1%), and Service Call (10.6%).
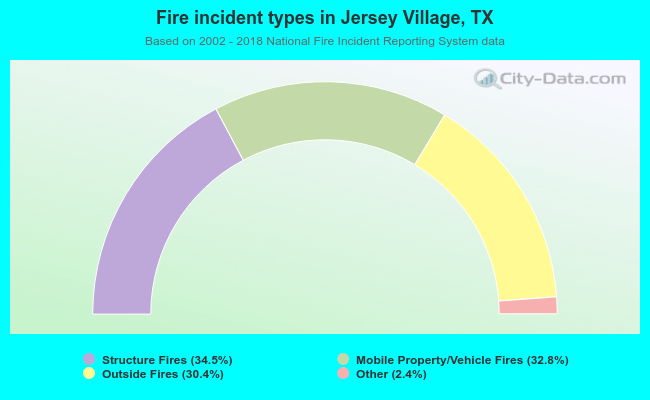 When looking into fire subcategories, the most reports belonged to: Structure Fires (34.5%), and Mobile Property/Vehicle Fires (32.8%).