Jourdanton: Fire Incidents, Texas (TX)
Where are fire incidents reported in Jourdanton, TX
Something went wrong! Please refresh the page.
|
| |||||||||||||||||||||||||||||||||||||||||||||||||||||||||||||||||||||||||||||||||||||||||||||||||||||||||||||
| Other | 161 | |||||||||||||||||||||||||||||||||||||||||||||||||||||||||||||||||||||||||||||||||||||||||||||||||||||||||||||
2003 - 2018 National Fire Incident Reporting System (NFIRS) incidents
- Incident types reported to NFIRS in Jourdanton, TX
- 80556.3%Fire
- 27419.1%Hazardous Condition
- 1258.7%Rescue & EMS
- 1148.0%Good Intent Call
- 745.2%Service Call
- 332.3%False Alarm
- 30.2%Overpressure Rupture
- 30.2%Special Incident
- Fire incident types reported to NFIRS in Jourdanton, TX
- 59273.5%Outside Fires
- 13416.6%Structure Fires
- 658.1%Mobile Property/Vehicle Fires
- 141.7%Other
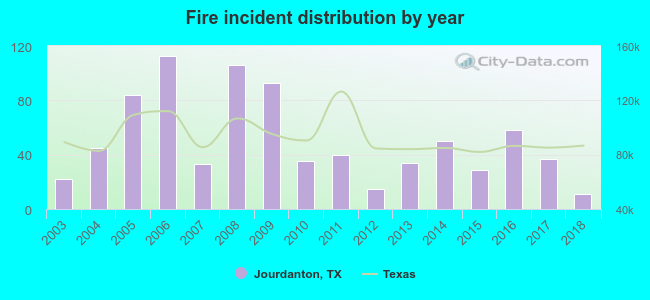 Based on the data from the years 2003 - 2018 the average number of fires per year is 50. The highest number of fires - 113 took place in 2006, and the least - 11 in 2018. The data has a declining trend.
 The median response time based on all reported fire incidents is 5 minutes. This is lower than the state median value.
The median response time in Jourdanton, TX compared to nearest cities:
(Note: Based on data for all years, including only cities with at least 500 fire incidents)
| Jourdanton: | 5 minutes |
| Pleasanton: | 8 minutes |
| Poteet: | 10 minutes |
| Von Ormy: | 5 minutes |
| Natalia: | 10 minutes |
| Devine: | 12 minutes |
| Floresville: | 12 minutes |
| Pearsall: | 10 minutes |
| Castroville: | 10 minutes |
 Based on the data from the years 2003 - 2018 the average number of fire-related fatalities per year is 1. The highest number of deaths - 4 took place in 2012, and the lowest - 0 in 2005. The data has a dropping trend.
 25.6% incidents where reported in the morning and 74.4% in the evening. The most fires (16.6%) took place on Monday, and the least (11.1%) on Thursday.
 According to the 805 fires from years 2003 - 2018 most fires (11.1%) took place during January, and the least (6.6%) in September.
 Out of all 1,431 cases reported during the years 2003 - 2018, the most belonged to the categories: Fire (56.3%), Hazardous Condition (19.1%), and Rescue & EMS (8.7%).
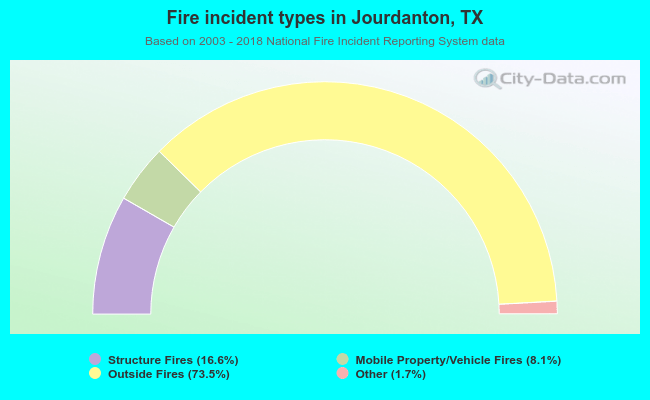 When looking into fire subcategories, the most incidents belonged to: Outside Fires (73.5%), and Structure Fires (16.6%).