Kent: Fire Incidents, Ohio (OH)
Where are fire incidents reported in Kent, OH
Something went wrong! Please refresh the page.
| Fire incidents reported | |
|---|---|
| Sreet name | Count |
| MAIN ST | 216 |
| WATER ST | 174 |
| GEMINI CT | 160 |
| COLLEGE AVE | 136 |
| LINCOLN ST | 104 |
| DEPEYSTER ST | 100 |
| SUMMIT ST | 92 |
| RHODES RD | 76 |
| COLLEGE ST | 74 |
| WILLOW ST | 70 |
| FRANKLIN AVE | 64 |
| SCORPIO CT | 60 |
| MANTUA ST | 58 |
| MORRIS RD | 58 |
| COLLEGE AV | 56 |
| CHERRY ST | 54 |
| SILVER MEADOWS BLVD | 42 |
| LAKE ST | 40 |
| ST RT 59 HWY | 40 |
| DALE DR | 38 |
| LIBRA CT | 34 |
| MOGADORE RD | 32 |
| UNIVERSITY DR | 32 |
| MIDDLEBURY RD | 30 |
| ARIES CT | 28 |
| STATE ROUTE 43 | 28 |
| 59 | 26 |
| CRAIN AVE | 26 |
| ELM ST | 26 |
| STRATFORD DR | 26 |
| Other | 165 |
2002 - 2018 National Fire Incident Reporting System (NFIRS) incidents
- Incident types reported to NFIRS in Kent, OH
- 13,89862.7%Rescue & EMS
- 2,36410.7%Hazardous Condition
- 2,1659.8%Fire
- 1,4036.3%Service Call
- 1,1525.2%Good Intent Call
- 1,0784.9%False Alarm
- 530.2%Severe Weather
- 240.1%Overpressure Rupture
- Fire incident types reported to NFIRS in Kent, OH
- 1,00246.3%Outside Fires
- 95944.3%Structure Fires
- 1959.0%Mobile Property/Vehicle Fires
- 90.4%Other
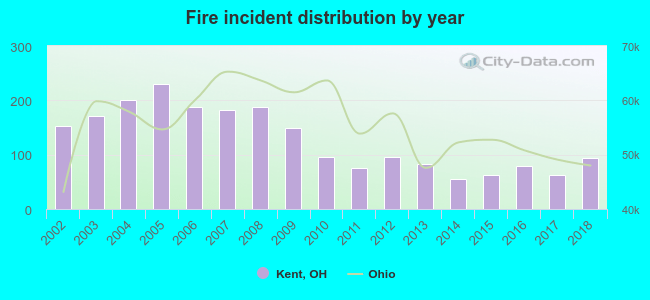 According to the data from the years 2002 - 2018 the average number of fires per year is 127. The highest number of reported fires - 230 took place in 2005, and the least - 55 in 2014. The data has a decreasing trend.
The average number of yearly fire incidents per 10k residents in Kent, OH compared to nearest cities:
(Note: Based on data for the last 3 years, including only cities with population 5,000 and above)
| Kent: | 26.5 |
| Munroe Falls: | 12.6 |
| Stow: | 18.6 |
| Tallmadge: | 28.1 |
| Ravenna: | 117.4 |
| Streetsboro: | 35.3 |
| Cuyahoga Falls: | 24.9 |
| Hudson: | 12.2 |
| Akron: | 43.8 |
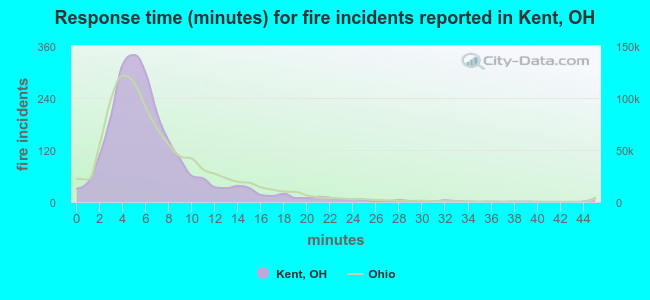 The median response time based on all reported fire incidents is 6 minutes. This is comparable to the state median value.
The median response time in Kent, OH compared to nearest cities:
(Note: Based on data for all years, including only cities with at least 500 fire incidents)
| Kent: | 6 minutes |
| Brimfield: | 6 minutes |
| Stow: | 5 minutes |
| Tallmadge: | 5 minutes |
| Ravenna: | 7 minutes |
| Streetsboro: | 6 minutes |
| Mogadore: | 6 minutes |
| Cuyahoga Falls: | 4 minutes |
| Hudson: | 6 minutes |
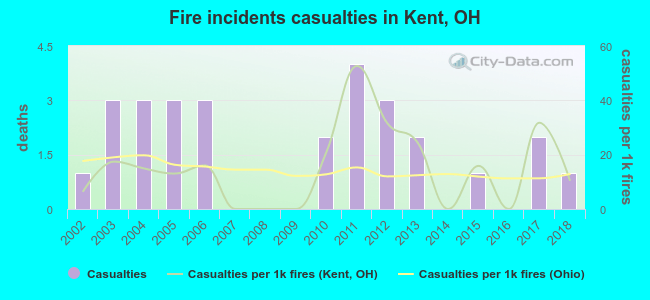 Based on the data from the years 2002 - 2018 the average number of fire-related casualties per year is 2. The highest number of reported casualties - 4 took place in 2011, and the lowest - 0 in 2007. The data has a constant trend.
The average number of injuries per 1,000 fire incidents is 15. This indicator was the highest - 53 in 2011, and the lowest 0 in 2007. The trend for injuries per 1,000 incidents is growing. Compared to the state value the number of injuries per 1,000 incidents is similar.
Based on the data from the years 2002 - 2018 the average number of fire-related casualties per year is 2. The highest number of reported casualties - 4 took place in 2011, and the lowest - 0 in 2007. The data has a constant trend.
The average number of injuries per 1,000 fire incidents is 15. This indicator was the highest - 53 in 2011, and the lowest 0 in 2007. The trend for injuries per 1,000 incidents is growing. Compared to the state value the number of injuries per 1,000 incidents is similar.Casualties per 1,000 incidents in Kent, OH compared to nearest cities:
(Note: Based on data for all years, including only cities with at least 500 fire incidents)
| Kent: | 12.9 |
| Brimfield: | 3.9 |
| Stow: | 43.1 |
| Tallmadge: | 23.7 |
| Ravenna: | 13.2 |
| Streetsboro: | 10.4 |
| Mogadore: | 10.3 |
| Cuyahoga Falls: | 41.0 |
| Hudson: | 1.6 |
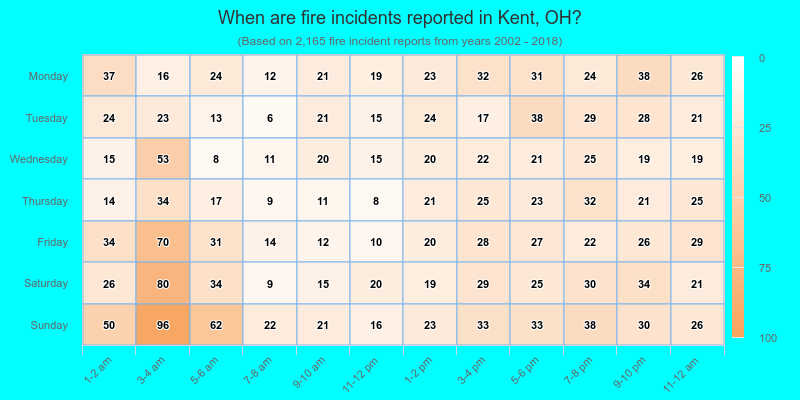
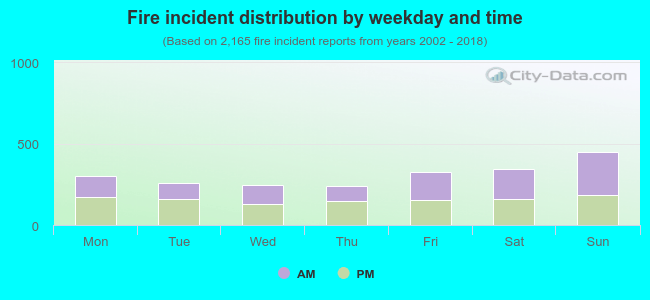 49.3% incidents where reported in the morning and 50.7% in the evening. The most fires (20.8%) took place on Sunday, and the least (11.1%) on Thursday.
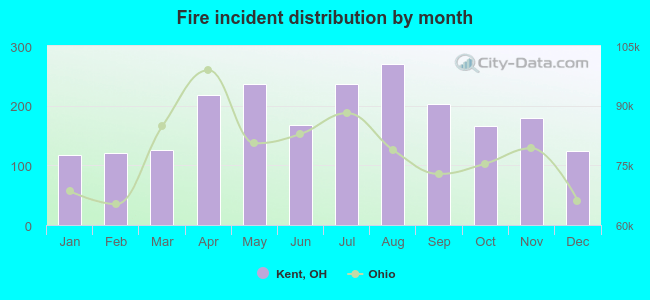 Based on the 2,165 fire incident reports from years 2002 - 2018 most fires (12.4%) took place during August, and the least (5.5%) in January.
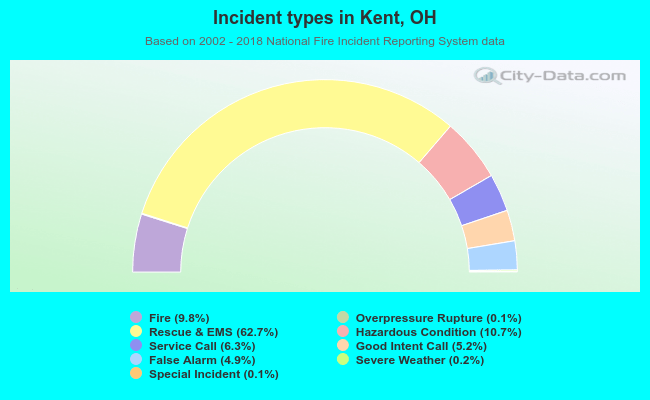 Out of all 22,153 cases reported during the years 2002 - 2018, the most belonged to the categories: Rescue & EMS (62.7%), Hazardous Condition (10.7%), and Fire (9.8%).
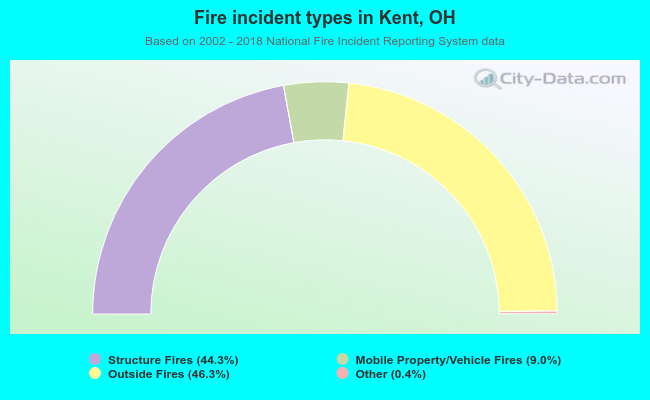 When looking into fire subcategories, the most reports belonged to: Outside Fires (46.3%), and Structure Fires (44.3%).