Lakemoor: Fire Incidents, Illinois (IL)
Where are fire incidents reported in Lakemoor, IL
Something went wrong! Please refresh the page.
|
| |||||||||||||||||||||||||||||||||||||||||||||||||||||||||||||||||||||||||||||||||||||||||||||||||||||||||||||
2002 - 2018 National Fire Incident Reporting System (NFIRS) incidents
- Incident types reported to NFIRS in Lakemoor, IL
- 1,31565.8%Rescue & EMS
- 1698.4%Fire
- 1698.4%Hazardous Condition
- 1407.0%Service Call
- 1346.7%False Alarm
- 663.3%Good Intent Call
- 40.2%Special Incident
- Fire incident types reported to NFIRS in Lakemoor, IL
- 7343.2%Structure Fires
- 5432.0%Outside Fires
- 3520.7%Mobile Property/Vehicle Fires
- 74.1%Other
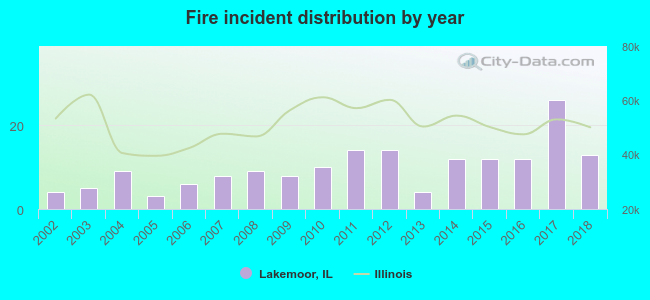 Based on the data from the years 2002 - 2018 the average number of fire incidents per year is 10. The highest number of reported fire incidents - 26 took place in 2017, and the least - 3 in 2005. The data has a rising trend.
The average number of yearly fire incidents per 10k residents in Lakemoor, IL compared to nearest cities:
(Note: Based on data for the last 3 years, including only cities with population 5,000 and above)
| Lakemoor: | 28.3 |
| Johnsburg: | 24.4 |
| Island Lake: | 28.6 |
| McHenry: | 43.8 |
| Fox Lake: | 42.2 |
| Round Lake: | 33.3 |
| Wauconda: | 41.0 |
| Round Lake Park: | 11.3 |
| Round Lake Beach: | 17.4 |

 33.7% incidents where reported in the morning and 66.3% in the evening. The most fires (16.0%) took place on Thursday, and the least (13.0%) on Monday.
 Based on the 169 fire incident reports from years 2002 - 2018 most fires (16.0%) took place during April, and the least (5.3%) in January.
 Out of all 2,000 cases reported during the years 2002 - 2018, the most belonged to the categories: Rescue & EMS (65.8%), Fire (8.4%), and Hazardous Condition (8.4%).
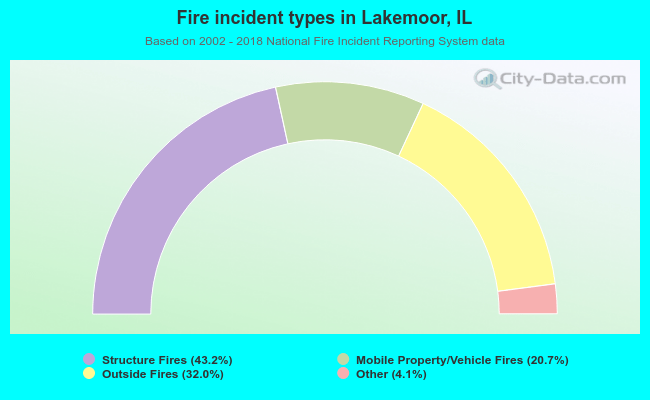 When looking into fire subcategories, the most incidents belonged to: Structure Fires (43.2%), and Outside Fires (32.0%).