Lawndale: Fire Incidents, California (CA)
Where are fire incidents reported in Lawndale, CA
Something went wrong! Please refresh the page.
|
| |||||||||||||||||||||||||||||||||||||||||||||||||||||||||||||||||||||||||||||||||||||||||||||||||||||||||||||
2005 - 2018 National Fire Incident Reporting System (NFIRS) incidents
- Incident types reported to NFIRS in Lawndale, CA
- 6,22064.2%Rescue & EMS
- 1,79318.5%Good Intent Call
- 7557.8%False Alarm
- 4224.4%Fire
- 3033.1%Hazardous Condition
- 1881.9%Service Call
- Fire incident types reported to NFIRS in Lawndale, CA
- 14835.1%Outside Fires
- 12930.6%Structure Fires
- 10825.6%Mobile Property/Vehicle Fires
- 378.8%Other
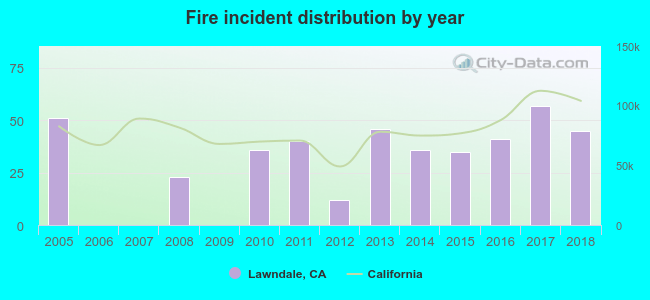 Based on the data from the years 2005 - 2018 the average number of fires per year is 30. The highest number of fires - 57 took place in 2017, and the least - 0 in 2006. The data has a dropping trend.
The average number of yearly fire incidents per 10k residents in Lawndale, CA compared to nearest cities:
(Note: Based on data for the last 3 years, including only cities with population 5,000 and above)
| Lawndale: | 14.3 |
| Hawthorne: | 18.5 |
| Redondo Beach: | 17.9 |
| Gardena: | 27.7 |
| Manhattan Beach: | 13.8 |
| Hermosa Beach: | 8.2 |
| Torrance: | 13.1 |
| Lennox: | 13.5 |
| El Segundo: | 31.3 |

 38.6% incidents where reported in the morning and 61.4% in the evening. The most fires (17.8%) took place on Sunday, and the least (12.3%) on Tuesday.
 According to the 422 reports from years 2005 - 2018 most fires (13.3%) took place during January, and the least (4.0%) in November.
 Out of all 9,689 cases reported during the years 2005 - 2018, the most belonged to the categories: Rescue & EMS (64.2%), Good Intent Call (18.5%), and False Alarm (7.8%).
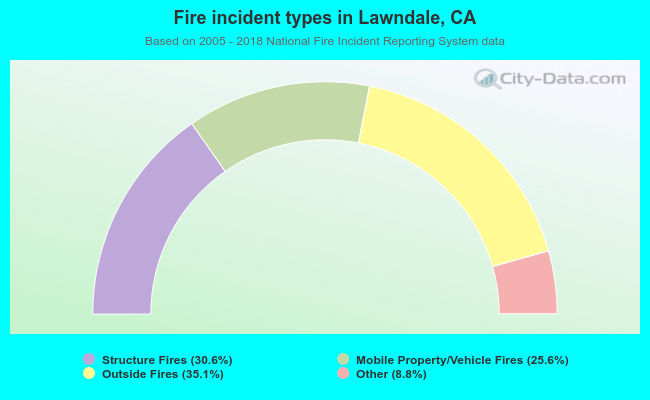 When looking into fire subcategories, the most incidents belonged to: Outside Fires (35.1%), and Structure Fires (30.6%).