Lindenhurst: Fire Incidents, Illinois (IL)
Where are fire incidents reported in Lindenhurst, IL
Something went wrong! Please refresh the page.
|
| |||||||||||||||||||||||||||||||||||||||||||||||||||||||||||||||||||||||||||||||||||||||||||||||||||||||||||||
2002 - 2018 National Fire Incident Reporting System (NFIRS) incidents
- Incident types reported to NFIRS in Lindenhurst, IL
- 2,66566.8%Rescue & EMS
- 56614.2%Hazardous Condition
- 3498.7%False Alarm
- 1854.6%Service Call
- 1604.0%Fire
- 611.5%Good Intent Call
- Fire incident types reported to NFIRS in Lindenhurst, IL
- 8050.0%Structure Fires
- 3220.0%Outside Fires
- 2616.3%Mobile Property/Vehicle Fires
- 2213.8%Other
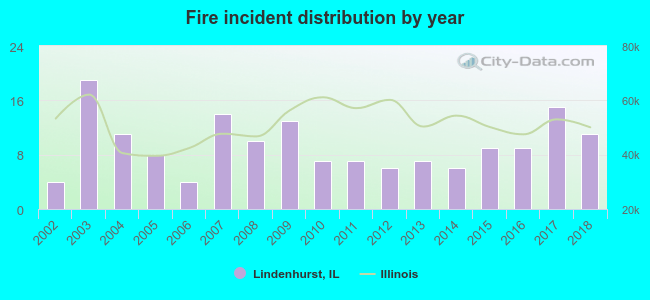 According to the data from the years 2002 - 2018 the average number of fires per year is 9. The highest number of fires - 19 took place in 2003, and the least - 4 in 2002. The data has a growing trend.
The average number of yearly fire incidents per 10k residents in Lindenhurst, IL compared to nearest cities:
(Note: Based on data for the last 3 years, including only cities with population 5,000 and above)
| Lindenhurst: | 8.1 |
| Lake Villa: | 38.1 |
| Round Lake Beach: | 17.4 |
| Grayslake: | 33.6 |
| Gages Lake: | 1.3 |
| Antioch: | 41.6 |
| Gurnee: | 23.7 |
| Round Lake Park: | 11.3 |
| Round Lake: | 33.3 |
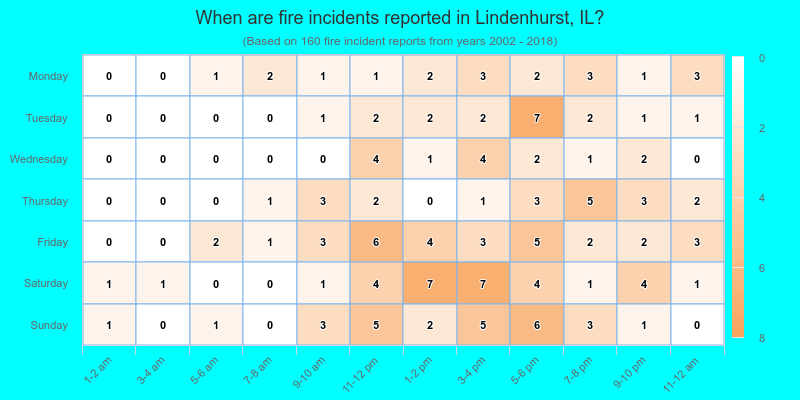
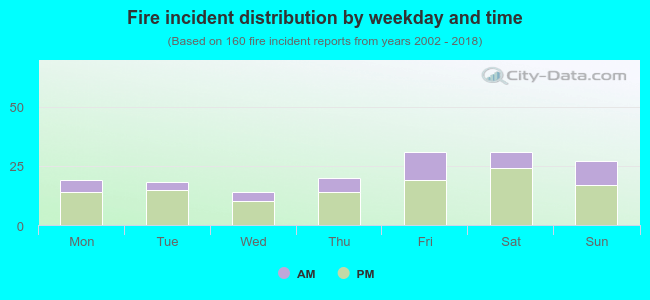 29.4% incidents where reported in the morning and 70.6% in the evening. The most fires (19.4%) took place on Friday, and the least (8.8%) on Wednesday.
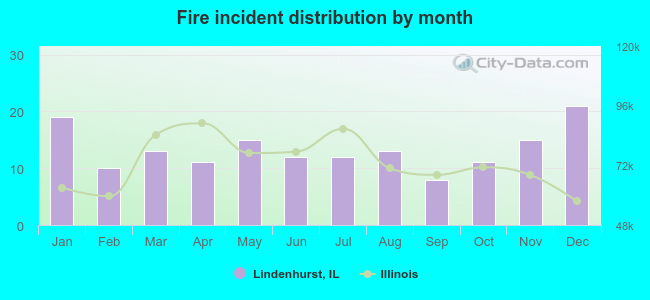 Based on the 160 incident reports from years 2002 - 2018 most fires (13.1%) took place during December, and the least (5.0%) in September.
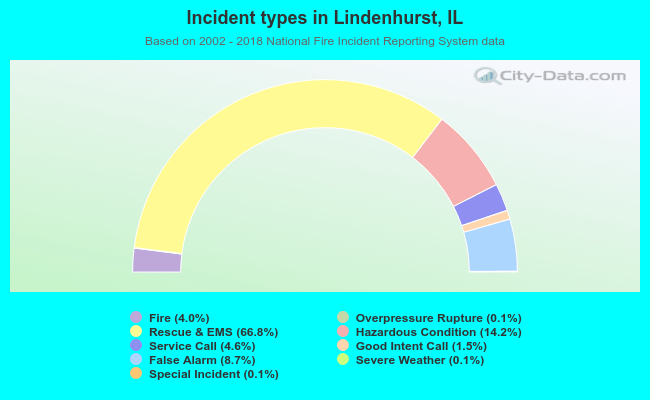 Out of all 3,992 cases reported during the years 2002 - 2018, the most belonged to the categories: Rescue & EMS (66.8%), Hazardous Condition (14.2%), and False Alarm (8.7%).
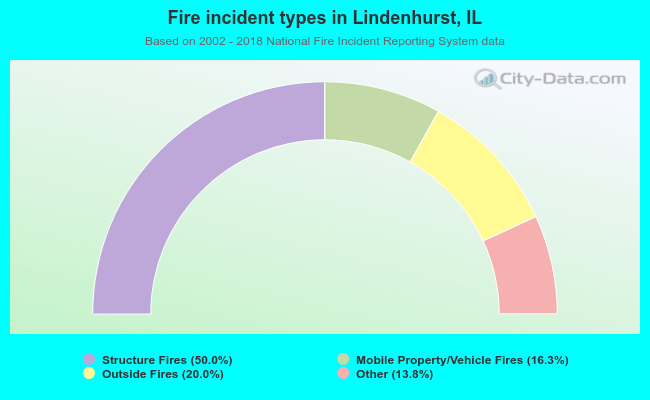 When looking into fire subcategories, the most incidents belonged to: Structure Fires (50.0%), and Outside Fires (20.0%).