Livonia: Fire Incidents, Michigan (MI)
Where are fire incidents reported in Livonia, MI
Something went wrong! Please refresh the page.
| Fire incidents reported | |
|---|---|
| Sreet name | Count |
| MIDDLEBELT | 128 |
| PLYMOUTH | 122 |
| PLYMOUTH RD | 108 |
| MIDDLEBELT RD | 104 |
| SCHOOLCRAFT RD | 102 |
| SCHOOLCRAFT | 100 |
| SEVEN MILE | 86 |
| FIVE MILE RD | 76 |
| INDUSTRIAL | 76 |
| MERRIMAN | 76 |
| FARMINGTON | 72 |
| SEVEN MILE RD | 66 |
| MERRIMAN RD | 58 |
| NEWBURGH | 50 |
| MAYFIELD | 46 |
| I96 | 44 |
| NEWBURGH RD | 44 |
| SIX MILE | 44 |
| FIVE MILE | 42 |
| LATHERS | 42 |
| FARMINGTON RD | 40 |
| LYNDON | 40 |
| SIX MILE RD | 38 |
| I275 | 36 |
| EIGHT MILE RD | 34 |
| GLENDALE | 34 |
| AMRHEIN | 32 |
| CURTIS | 32 |
| DEERING | 32 |
| HUBBARD | 30 |
| Other | 628 |
2002 - 2018 National Fire Incident Reporting System (NFIRS) incidents
- Incident types reported to NFIRS in Livonia, MI
- 5,04540.9%Hazardous Condition
- 2,81522.8%False Alarm
- 2,46220.0%Fire
- 9197.5%Good Intent Call
- 6335.1%Service Call
- 2732.2%Rescue & EMS
- 1120.9%Overpressure Rupture
- 620.5%Special Incident
- Fire incident types reported to NFIRS in Livonia, MI
- 83533.9%Outside Fires
- 70828.8%Mobile Property/Vehicle Fires
- 57823.5%Structure Fires
- 34113.9%Other
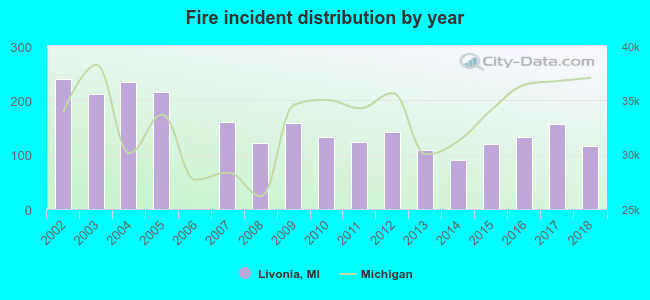 Based on the data from the years 2002 - 2018 the average number of fire incidents per year is 145. The highest number of reported fire incidents - 240 took place in 2002, and the least - 0 in 2006. The data has a declining trend.
The average number of yearly fire incidents per 10k residents in Livonia, MI compared to nearest cities:
(Note: Based on data for the last 3 years, including only cities with population 5,000 and above)
| Livonia: | 14.2 |
| Redford: | 0.2 |
| Farmington: | 18.3 |
| Garden City: | 29.7 |
| Westland: | 25.0 |
| Plymouth: | 102.2 |
| Plymouth Township: | 2.4 |
| Farmington Hills: | 15.0 |
| Northville: | 96.4 |
 The median response time based on all reported fire incidents is 4 minutes. This is lower compared to the state median value.
The median response time in Livonia, MI compared to nearest cities:
(Note: Based on data for all years, including only cities with at least 500 fire incidents)
| Livonia: | 4 minutes |
| Garden City: | 5 minutes |
| Westland: | 6 minutes |
| Plymouth: | 6 minutes |
| Farmington Hills: | 8 minutes |
| Northville: | 7 minutes |
| Dearborn Heights: | 6 minutes |
| Inkster: | 5 minutes |
| Canton: | 6 minutes |
 According to the reports from the years 2002 - 2018 the average number of fire-related fatalities per year is 0. The highest number of reported deaths - 2 took place in 2004, and the lowest - 0 in 2002. The data has a rising trend.
 Based on the reports from the years 2002 - 2018 the average number of fire-related casualties per year is 2. The highest number of reported injuries - 9 took place in 2007, and the lowest - 0 in 2006. The data has a decreasing trend.
The average number of casualties per 1,000 fire incidents is 12. This indicator was the highest - 56 in 2007, and the lowest 0 in 2006. The trend for casualties per 1,000 fires is decreasing. Compared to the Michigan value the number of casualties per 1,000 fire incidents is about the same.
Based on the reports from the years 2002 - 2018 the average number of fire-related casualties per year is 2. The highest number of reported injuries - 9 took place in 2007, and the lowest - 0 in 2006. The data has a decreasing trend.
The average number of casualties per 1,000 fire incidents is 12. This indicator was the highest - 56 in 2007, and the lowest 0 in 2006. The trend for casualties per 1,000 fires is decreasing. Compared to the Michigan value the number of casualties per 1,000 fire incidents is about the same.Casualties per 1,000 incidents in Livonia, MI compared to nearest cities:
(Note: Based on data for all years, including only cities with at least 500 fire incidents)
| Livonia: | 13.8 |
| Garden City: | 29.5 |
| Westland: | 14.1 |
| Plymouth: | 9.3 |
| Farmington Hills: | 48.2 |
| Northville: | 16.0 |
| Dearborn Heights: | 21.4 |
| Inkster: | 8.1 |
| Canton: | 24.2 |
 29.6% incidents where reported in the morning and 70.4% in the evening. The most fires (15.4%) took place on Sunday, and the least (13.4%) on Friday.
 According to the 2,462 fire incidents from years 2002 - 2018 most fires (12.7%) took place during July, and the least (5.7%) in February.
 Out of all 12,325 cases reported during the years 2002 - 2018, the most belonged to the categories: Hazardous Condition (40.9%), False Alarm (22.8%), and Fire (20.0%).
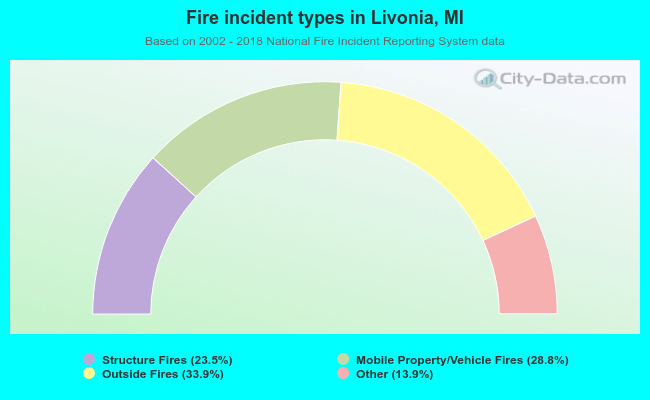 When looking into fire subcategories, the most incidents belonged to: Outside Fires (33.9%), and Mobile Property/Vehicle Fires (28.8%).