Plymouth: Fire Incidents, Michigan (MI)
Where are fire incidents reported in Plymouth, MI
Something went wrong! Please refresh the page.
| Fire incidents reported | |
|---|---|
| Sreet name | Count |
| ANN ARBOR RD | 106 |
| HAGGERTY RD | 52 |
| SHELDON | 46 |
| FIVE MILE RD | 42 |
| PLYMOUTH RD | 42 |
| JOY RD | 36 |
| ANN ARBOR TRL | 32 |
| MAIN ST | 28 |
| WB M-14 | 28 |
| BECK RD | 22 |
| M14 | 22 |
| SHELDON RD | 22 |
| HAGGERTY | 20 |
| M-14 | 20 |
| STATE 14 HWY | 20 |
| MILL | 18 |
| MILL ST | 18 |
| NB 275 | 18 |
| NORTH TERRITORIAL RD | 18 |
| SHERIDAN | 18 |
| BECK | 16 |
| FIVE MILE | 16 |
| JUNCTION | 16 |
| NORTHVILLE RD | 16 |
| PENNIMAN | 16 |
| PLYMOUTH OAKS BLVD | 16 |
| FARMER | 14 |
| GENERAL DR | 14 |
| HOLBROOK | 14 |
| N. TERRITORIAL | 14 |
| Other | 293 |
2002 - 2018 National Fire Incident Reporting System (NFIRS) incidents
- Incident types reported to NFIRS in Plymouth, MI
- 8,60955.6%Rescue & EMS
- 2,52716.3%Hazardous Condition
- 1,1657.5%False Alarm
- 1,1027.1%Good Intent Call
- 1,0736.9%Fire
- 9246.0%Service Call
- 650.4%Special Incident
- 230.1%Overpressure Rupture
- Fire incident types reported to NFIRS in Plymouth, MI
- 44841.8%Structure Fires
- 28226.3%Mobile Property/Vehicle Fires
- 27525.6%Outside Fires
- 686.3%Other
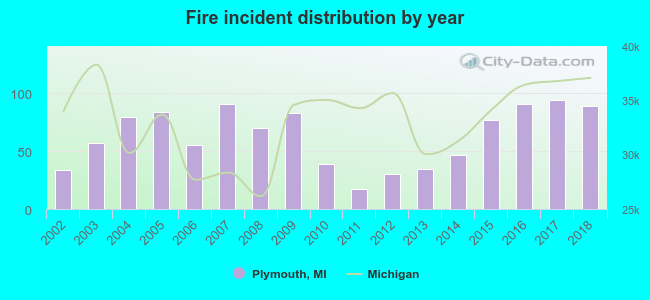 According to the data from the years 2002 - 2018 the average number of fire incidents per year is 63. The highest number of fires - 94 took place in 2017, and the least - 17 in 2011. The data has a growing trend.
The average number of yearly fire incidents per 10k residents in Plymouth, MI compared to nearest cities:
(Note: Based on data for the last 3 years, including only cities with population 5,000 and above)
| Plymouth: | 102.2 |
| Plymouth Township: | 2.4 |
| Canton: | 16.6 |
| Northville: | 96.4 |
| Livonia: | 14.2 |
| Westland: | 25.0 |
| Garden City: | 29.7 |
| Novi: | 17.0 |
| Farmington: | 18.3 |
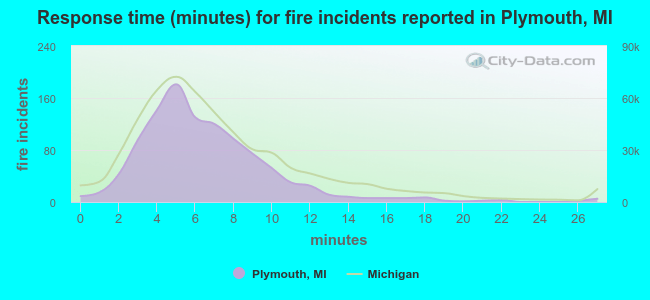 The median response time based on all reported fire incidents is 6 minutes. This is about the same as the Michigan median value.
The median response time in Plymouth, MI compared to nearest cities:
(Note: Based on data for all years, including only cities with at least 500 fire incidents)
| Plymouth: | 6 minutes |
| Canton: | 6 minutes |
| Northville: | 7 minutes |
| Livonia: | 4 minutes |
| Westland: | 6 minutes |
| Garden City: | 5 minutes |
| Novi: | 6 minutes |
| Wayne: | 5 minutes |
| Farmington Hills: | 8 minutes |
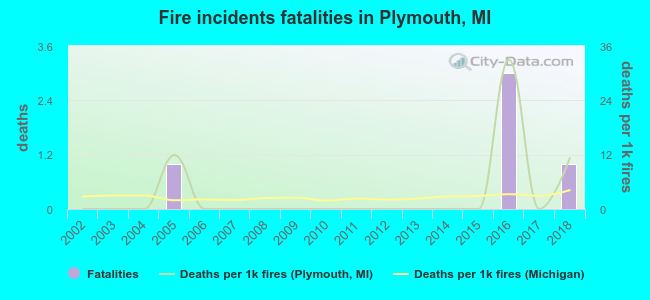 Based on the data from the years 2002 - 2018 the average number of fire-related yearly deaths is 0. The highest number of reported deaths - 3 took place in 2016, and the lowest - 0 in 2002. The data has an increasing trend.
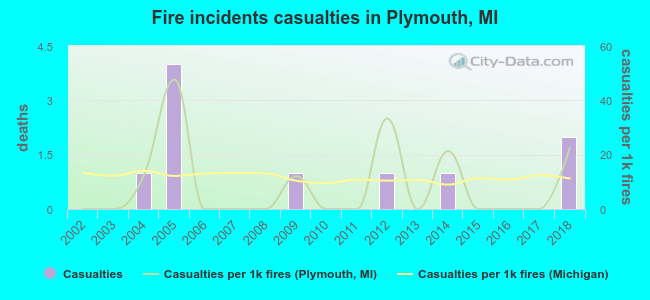 According to the data from the years 2002 - 2018 the average number of fire-related yearly casualties is 1. The highest number of casualties - 4 took place in 2005, and the lowest - 0 in 2002. The data has a rising trend.
The average number of injuries per 1,000 fires is 9. This indicator was the highest - 48 in 2005, and the lowest 0 in 2002. The trend for injuries per 1,000 fire incidents is growing. Compared to the state value the number of injuries per 1,000 incidents is lower.
According to the data from the years 2002 - 2018 the average number of fire-related yearly casualties is 1. The highest number of casualties - 4 took place in 2005, and the lowest - 0 in 2002. The data has a rising trend.
The average number of injuries per 1,000 fires is 9. This indicator was the highest - 48 in 2005, and the lowest 0 in 2002. The trend for injuries per 1,000 fire incidents is growing. Compared to the state value the number of injuries per 1,000 incidents is lower.Casualties per 1,000 incidents in Plymouth, MI compared to nearest cities:
(Note: Based on data for all years, including only cities with at least 500 fire incidents)
| Plymouth: | 9.3 |
| Canton: | 24.2 |
| Northville: | 16.0 |
| Livonia: | 13.8 |
| Westland: | 14.1 |
| Garden City: | 29.5 |
| Novi: | 33.3 |
| Wayne: | 31.8 |
| Farmington Hills: | 48.2 |
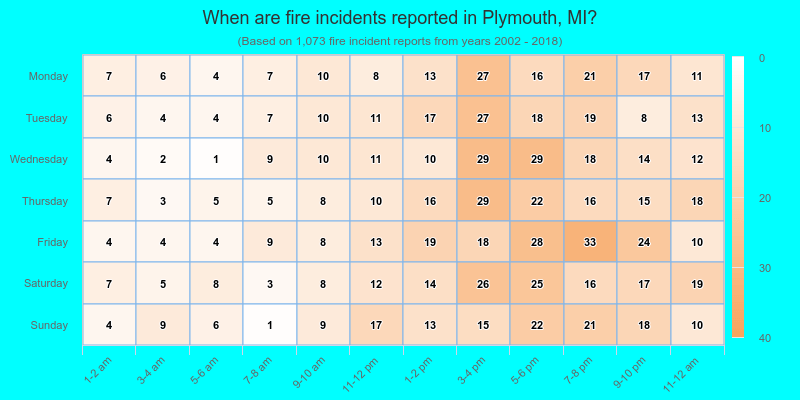
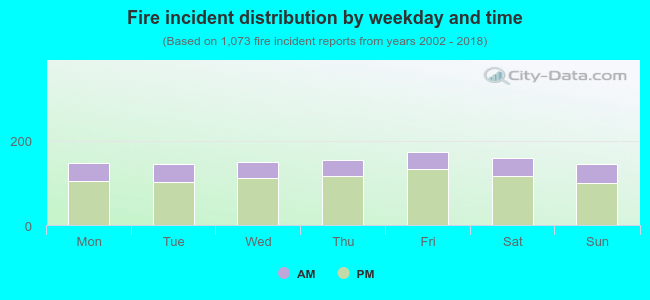 27.0% incidents where reported in the morning and 73.0% in the evening. The most fires (16.2%) took place on Friday, and the least (13.4%) on Tuesday.
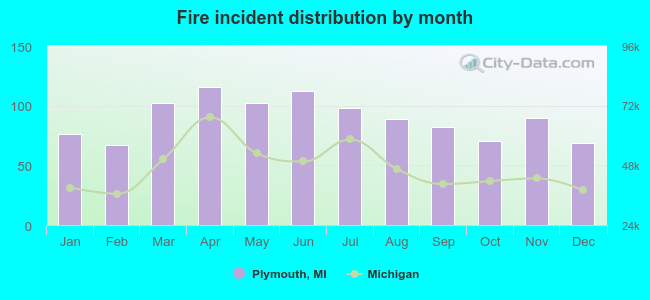 Based on the 1,073 fire incidents from years 2002 - 2018 most fires (10.8%) took place during April, and the least (6.2%) in February.
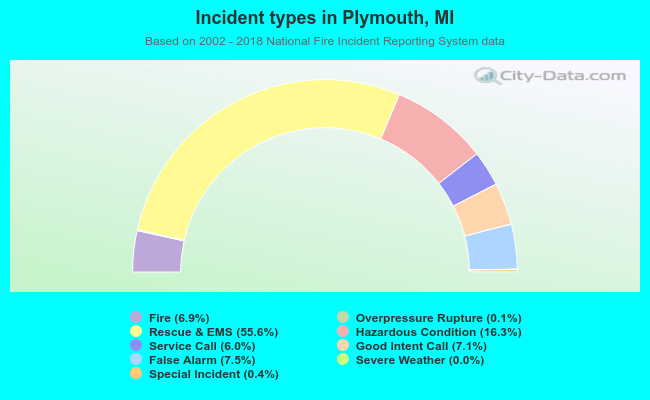 Out of all 15,494 cases reported during the years 2002 - 2018, the most belonged to the categories: Rescue & EMS (55.6%), Hazardous Condition (16.3%), and False Alarm (7.5%).
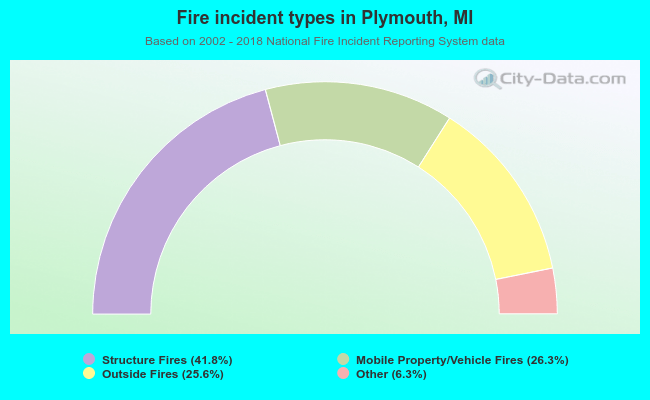 When looking into fire subcategories, the most incidents belonged to: Structure Fires (41.8%), and Mobile Property/Vehicle Fires (26.3%).