Mansfield: Fire Incidents, Ohio (OH)
Where are fire incidents reported in Mansfield, OH
Something went wrong! Please refresh the page.
| Fire incidents reported | |
|---|---|
| Sreet name | Count |
| PARK AVE | 310 |
| MAIN ST | 266 |
| ASHLAND RD | 212 |
| FOURTH ST | 208 |
| TRIMBLE RD | 190 |
| BOWMAN ST | 186 |
| LEXINGTON AVE | 168 |
| DIAMOND ST | 166 |
| 4TH ST | 158 |
| COOK RD | 146 |
| 3RD ST | 118 |
| LONGVIEW AVE | 118 |
| WOOD ST | 118 |
| WAYNE ST | 116 |
| MULBERRY ST | 102 |
| SPRINGMILL ST | 102 |
| LENOX AVE | 98 |
| 2ND ST | 90 |
| BLYMYER AVE | 86 |
| CRIDER RD | 84 |
| GRACE ST | 84 |
| KING ST | 82 |
| MCPHERSON ST | 82 |
| 5TH ST | 80 |
| MILLSBORO RD | 80 |
| STURGES AVE | 80 |
| LEXINGTON-SPRINGMILL RD | 78 |
| WOODVILLE RD | 78 |
| 1ST ST | 76 |
| BELMONT AVE | 76 |
| Other | 3,804 |
2002 - 2018 National Fire Incident Reporting System (NFIRS) incidents
- Incident types reported to NFIRS in Mansfield, OH
- 8,32424.9%Hazardous Condition
- 7,64222.9%Fire
- 7,62922.9%Rescue & EMS
- 3,53010.6%Service Call
- 3,34710.0%False Alarm
- 2,5797.7%Good Intent Call
- 1520.5%Special Incident
- 950.3%Overpressure Rupture
- 710.2%Severe Weather
- Fire incident types reported to NFIRS in Mansfield, OH
- 3,63447.6%Structure Fires
- 2,81436.8%Outside Fires
- 1,10814.5%Mobile Property/Vehicle Fires
- 861.1%Other
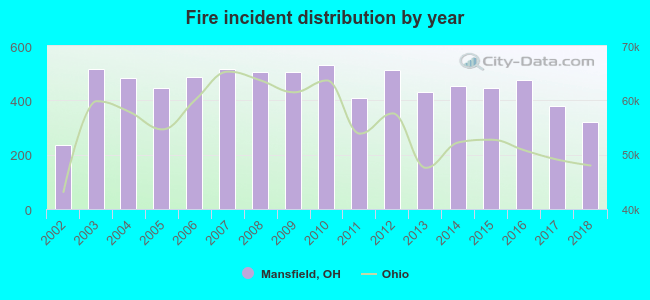 Based on the data from the years 2002 - 2018 the average number of fire incidents per year is 450. The highest number of fire incidents - 531 took place in 2010, and the least - 234 in 2002. The data has an increasing trend.
The average number of yearly fire incidents per 10k residents in Mansfield, OH compared to nearest cities:
(Note: Based on data for the last 3 years, including only cities with population 5,000 and above)
| Mansfield: | 83.5 |
| Ontario: | 34.8 |
| Shelby: | 62.4 |
| Ashland: | 43.4 |
| Galion: | 54.7 |
| Willard: | 78.2 |
| Bucyrus: | 55.4 |
| Mount Vernon: | 60.2 |
| Wooster: | 43.3 |
 The median response time based on all reported fire incidents is 4 minutes. This is lower compared to the Ohio median value.
The median response time in Mansfield, OH compared to nearest cities:
(Note: Based on data for all years, including only cities with at least 500 fire incidents)
| Mansfield: | 4 minutes |
| Lexington: | 10 minutes |
| Shelby: | 5 minutes |
| Crestline: | 7 minutes |
| Ashland: | 7 minutes |
| Galion: | 6 minutes |
| Fredericktown: | 11 minutes |
| Willard: | 7 minutes |
| Bucyrus: | 5 minutes |
 According to the data from the years 2002 - 2018 the average number of fire-related fatalities per year is 1. The highest number of deaths - 4 took place in 2015, and the lowest - 0 in 2002. The data has a growing trend.
The average number of fatalities per 1,000 fire incidents is 2. This indicator was the highest - 9 in 2015, and the lowest 0 in 2002. The trend for deaths per 1,000 incidents is rising. Compared to the state value the number of deaths per 1,000 fire incidents is similar.
According to the data from the years 2002 - 2018 the average number of fire-related fatalities per year is 1. The highest number of deaths - 4 took place in 2015, and the lowest - 0 in 2002. The data has a growing trend.
The average number of fatalities per 1,000 fire incidents is 2. This indicator was the highest - 9 in 2015, and the lowest 0 in 2002. The trend for deaths per 1,000 incidents is rising. Compared to the state value the number of deaths per 1,000 fire incidents is similar.Deaths per 1,000 incidents in Mansfield, OH compared to nearest cities:
(Note: Based on data for all years, including only cities with at least 2,500 fire incidents)
| Mansfield: | 2.2 |
| Marion: | 2.3 |
 Based on the data from the years 2002 - 2018 the average number of fire-related yearly casualties is 11. The highest number of reported casualties - 21 took place in 2008, and the lowest - 2 in 2018. The data has a dropping trend.
The average number of casualties per 1,000 fire incidents is 25. This indicator was the highest - 42 in 2008, and the lowest 6 in 2018. The trend for injuries per 1,000 fires is dropping. Compared to the state value the number of injuries per 1,000 fires is higher.
Based on the data from the years 2002 - 2018 the average number of fire-related yearly casualties is 11. The highest number of reported casualties - 21 took place in 2008, and the lowest - 2 in 2018. The data has a dropping trend.
The average number of casualties per 1,000 fire incidents is 25. This indicator was the highest - 42 in 2008, and the lowest 6 in 2018. The trend for injuries per 1,000 fires is dropping. Compared to the state value the number of injuries per 1,000 fires is higher.
 29.5% incidents where reported in the morning and 70.5% in the evening. The most fires (15.4%) took place on Saturday, and the least (13.5%) on Thursday.
 According to the 7,642 reports from years 2002 - 2018 most fires (10.1%) took place during April, and the least (6.4%) in February.
 Out of all 33,369 cases reported during the years 2002 - 2018, the most belonged to the categories: Hazardous Condition (24.9%), Fire (22.9%), and Rescue & EMS (22.9%).
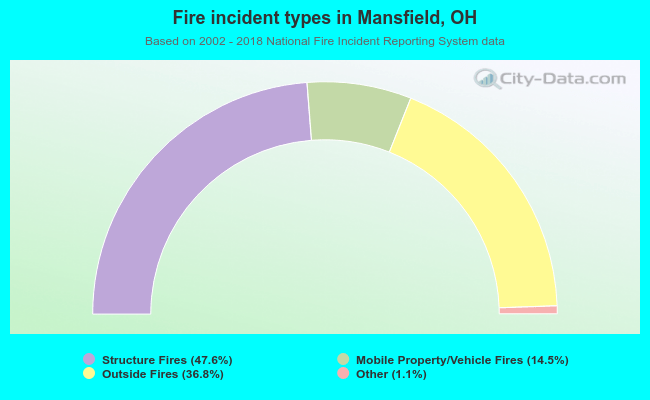 When looking into fire subcategories, the most reports belonged to: Structure Fires (47.6%), and Outside Fires (36.8%).