Margate City: Fire Incidents, New Jersey (NJ)
Where are fire incidents reported in Margate City, NJ
Something went wrong! Please refresh the page.
|
| |||||||||||||||||||||||||||||||||||||||||||||||||||||||||||||||||||||||||||||||||||||||||||||||||||||||||||||
2002 - 2018 National Fire Incident Reporting System (NFIRS) incidents
- Incident types reported to NFIRS in Margate City, NJ
- 3,06041.7%Rescue & EMS
- 1,80324.6%Hazardous Condition
- 1,04314.2%Service Call
- 73110.0%False Alarm
- 3825.2%Fire
- 2944.0%Good Intent Call
- 160.2%Overpressure Rupture
- 80.1%Special Incident
- Fire incident types reported to NFIRS in Margate City, NJ
- 17545.8%Structure Fires
- 14237.2%Outside Fires
- 379.7%Other
- 287.3%Mobile Property/Vehicle Fires
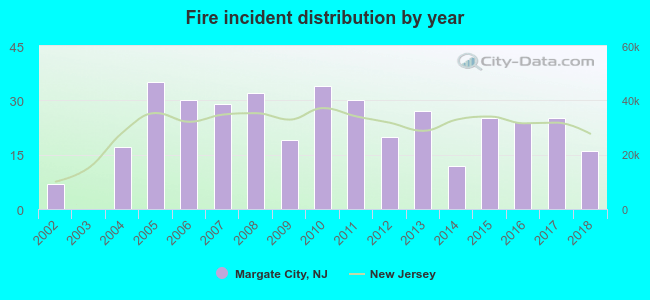 Based on the data from the years 2002 - 2018 the average number of fires per year is 22. The highest number of reported fire incidents - 35 took place in 2005, and the least - 0 in 2003. The data has an increasing trend.
The average number of yearly fire incidents per 10k residents in Margate City, NJ compared to nearest cities:
(Note: Based on data for the last 3 years, including only cities with population 5,000 and above)
| Margate City: | 34.2 |
| Linwood: | 12.3 |
| Northfield: | 31.0 |
| Atlantic City: | 61.0 |
| Pleasantville: | 46.4 |
| Somers Point: | 43.1 |
| Ocean City: | 41.3 |
| Absecon: | 17.1 |
| Brigantine: | 37.1 |
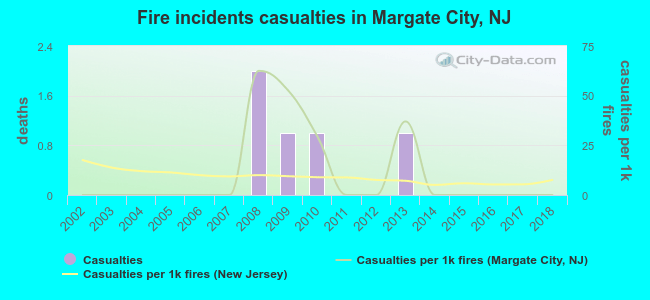 According to the reports from the years 2002 - 2018 the average number of fire-related yearly casualties is 0. The highest number of reported injuries - 2 took place in 2008, and the lowest - 0 in 2002. The data has a constant trend.
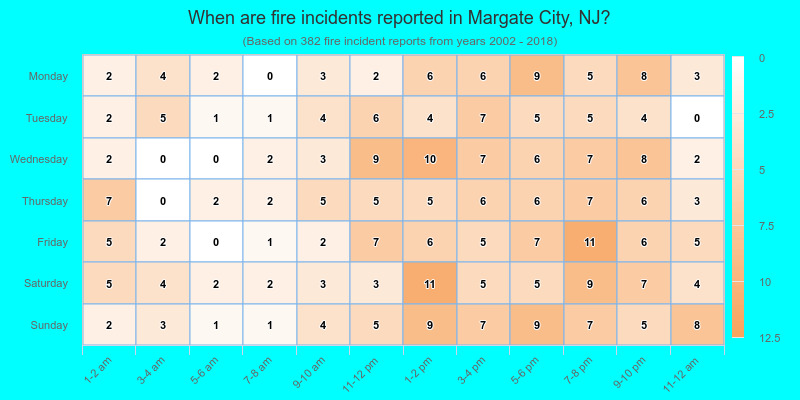
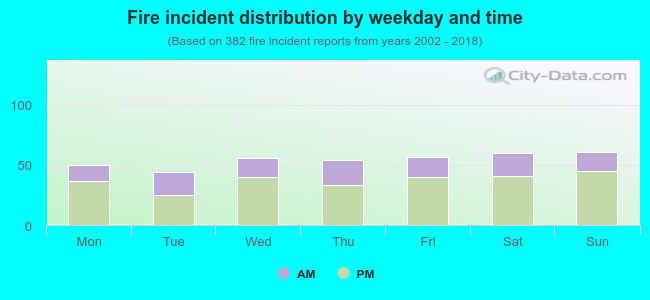 31.7% incidents where reported in the morning and 68.3% in the evening. The most fires (16.0%) took place on Sunday, and the least (11.5%) on Tuesday.
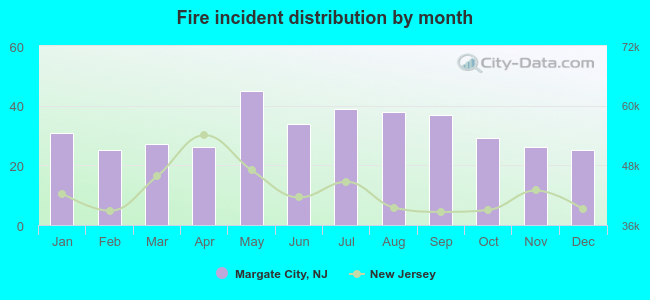 According to the 382 fire incident reports from years 2002 - 2018 most fires (11.8%) took place during May, and the least (6.5%) in February.
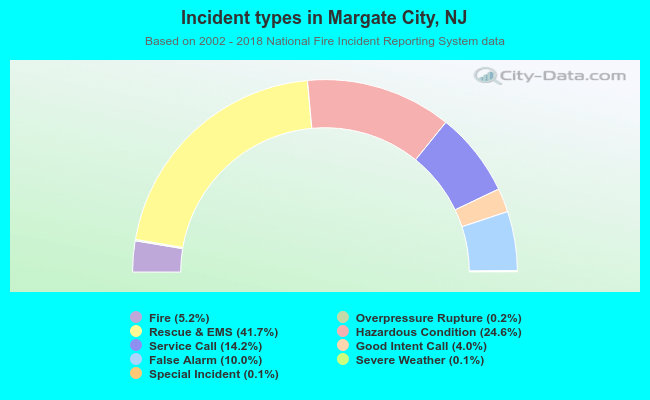 Out of all 7,343 cases reported during the years 2002 - 2018, the most belonged to the categories: Rescue & EMS (41.7%), Hazardous Condition (24.6%), and Service Call (14.2%).
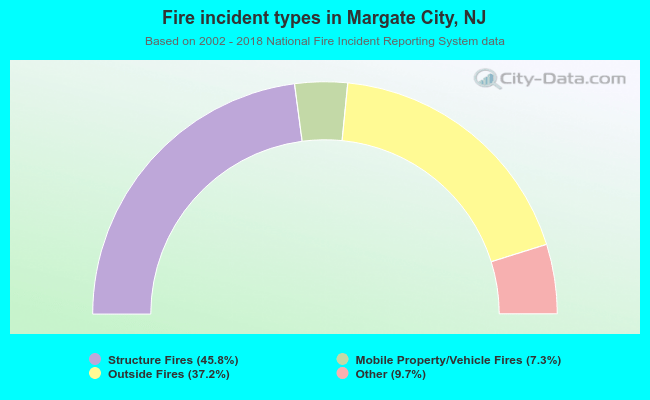 When looking into fire subcategories, the most reports belonged to: Structure Fires (45.8%), and Outside Fires (37.2%).