Metuchen: Fire Incidents, New Jersey (NJ)
Where are fire incidents reported in Metuchen, NJ
Something went wrong! Please refresh the page.
|
| |||||||||||||||||||||||||||||||||||||||||||||||||||||||||||||||||||||||||||||||||||||||||||||||||||||||||||||
2002 - 2018 National Fire Incident Reporting System (NFIRS) incidents
- Incident types reported to NFIRS in Metuchen, NJ
- 76335.4%Hazardous Condition
- 75034.8%False Alarm
- 34315.9%Fire
- 1697.8%Service Call
- 843.9%Good Intent Call
- 421.9%Rescue & EMS
- 30.1%Severe Weather
- Fire incident types reported to NFIRS in Metuchen, NJ
- 20058.3%Structure Fires
- 6519.0%Outside Fires
- 4212.2%Mobile Property/Vehicle Fires
- 3610.5%Other
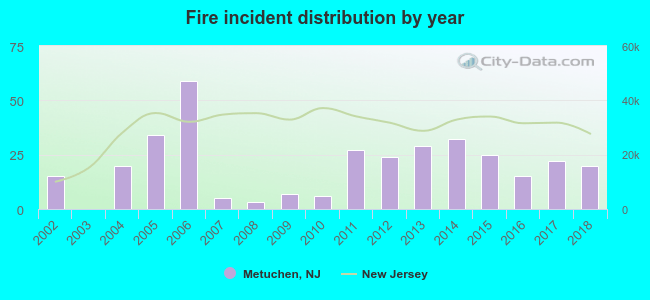 Based on the data from the years 2002 - 2018 the average number of fires per year is 20. The highest number of fires - 59 took place in 2006, and the least - 0 in 2003. The data has a growing trend.
The average number of yearly fire incidents per 10k residents in Metuchen, NJ compared to nearest cities:
(Note: Based on data for the last 3 years, including only cities with population 5,000 and above)
| Metuchen: | 13.7 |
| Edison: | 3.6 |
| Fords: | 1.1 |
| Iselin: | 22.5 |
| South Plainfield: | 48.3 |
| Woodbridge: | 34.1 |
| Colonia: | 16.5 |
| Highland Park: | 19.4 |
| Perth Amboy: | 32.8 |

 27.7% incidents where reported in the morning and 72.3% in the evening. The most fires (16.0%) took place on Monday, and the least (10.8%) on Friday.
 Based on the 343 fire incidents from years 2002 - 2018 most fires (10.8%) took place during April, and the least (5.8%) in September.
 Out of all 2,154 cases reported during the years 2002 - 2018, the most belonged to the categories: Rescue & EMS (35.4%), Good Intent Call (34.8%), and Fire (15.9%).
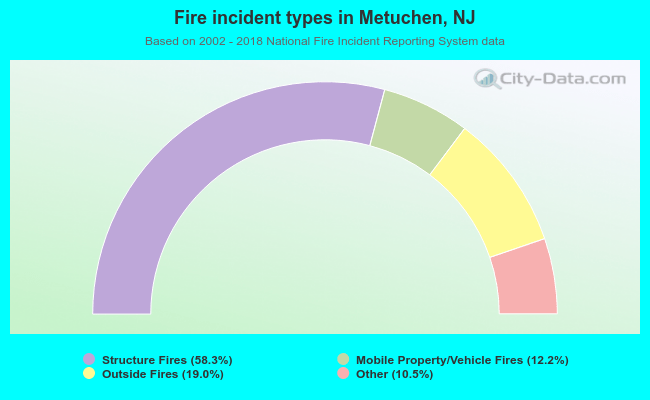 When looking into fire subcategories, the most incidents belonged to: Structure Fires (58.3%), and Outside Fires (19.0%).