Middlesex: Fire Incidents, North Carolina (NC)
Where are fire incidents reported in Middlesex, NC
Something went wrong! Please refresh the page.
|
| |||||||||||||||||||||||||||||||||||||||||||||||||||||||||||||||||||||||||||||||||||||||||||||||||||||||||||||
2002 - 2018 National Fire Incident Reporting System (NFIRS) incidents
- Incident types reported to NFIRS in Middlesex, NC
- 1,76244.6%Rescue & EMS
- 93623.7%Fire
- 71818.2%Good Intent Call
- 2656.7%Hazardous Condition
- 1704.3%False Alarm
- 812.1%Service Call
- 130.3%Severe Weather
- Fire incident types reported to NFIRS in Middlesex, NC
- 44047.0%Structure Fires
- 37840.4%Outside Fires
- 10010.7%Mobile Property/Vehicle Fires
- 181.9%Other
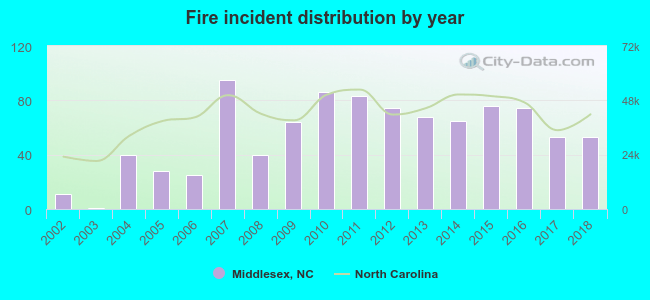 According to the data from the years 2002 - 2018 the average number of fires per year is 55. The highest number of fire incidents - 95 took place in 2007, and the least - 1 in 2003. The data has a rising trend.
 The median response time based on all reported fire incidents is 9 minutes. This is higher compared to the North Carolina median value.
The median response time in Middlesex, NC compared to nearest cities:
(Note: Based on data for all years, including only cities with at least 500 fire incidents)
| Middlesex: | 9 minutes |
| Bailey: | 10 minutes |
| Zebulon: | 6 minutes |
| Wendell: | 6 minutes |
| Spring Hope: | 11 minutes |
| Bunn: | 8 minutes |
| Kenly: | 8 minutes |
| Knightdale: | 5 minutes |
| Wilson: | 5 minutes |
 28.6% incidents where reported in the morning and 71.4% in the evening. The most fires (17.7%) took place on Monday, and the least (10.0%) on Thursday.
 Based on the 936 reports from years 2002 - 2018 most fires (14.3%) took place during March, and the least (4.7%) in October.
 Out of all 3,949 cases reported during the years 2002 - 2018, the most belonged to the categories: Rescue & EMS (44.6%), Fire (23.7%), and Good Intent Call (18.2%).
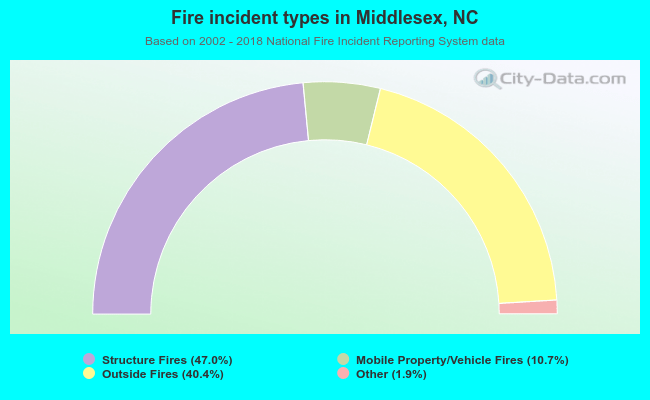 When looking into fire subcategories, the most reports belonged to: Structure Fires (47.0%), and Outside Fires (40.4%).