Knightdale: Fire Incidents, North Carolina (NC)
Where are fire incidents reported in Knightdale, NC
Something went wrong! Please refresh the page.
| Fire incidents reported | |
|---|---|
| Sreet name | Count |
| KNIGHTDALE BLVD | 220 |
| SMITHFIELD RD | 182 |
| HODGE RD | 148 |
| POOLE RD | 124 |
| U.S. 64 HWY | 104 |
| US 64 HWY | 94 |
| I-540 | 58 |
| I540 | 58 |
| BETHLEHEM RD | 52 |
| OLD MILBURNIE RD | 52 |
| FORESTVILLE RD | 44 |
| ROBERTSON ST | 44 |
| SANDY RUN | 44 |
| FIRST AVE | 42 |
| WIDEWATERS PKY | 42 |
| OLD KNIGHT RD | 40 |
| PARK AVE | 38 |
| HESTER ST | 36 |
| MARKS CREEK RD | 36 |
| MEADOW RUN | 36 |
| SANDY TRAIL DR | 34 |
| GRASSHOPPER RD | 32 |
| FAYETTEVILLE ST | 30 |
| OLD FAISON RD | 28 |
| SHOPPES AT MIDWAY DR | 28 |
| ARAGON DR | 26 |
| BROOKFIELD DR | 26 |
| I495 | 26 |
| KNIGHTDALE EAGLE ROCK RD | 26 |
| DELHAM RD | 24 |
| Other | 706 |
2002 - 2018 National Fire Incident Reporting System (NFIRS) incidents
- Incident types reported to NFIRS in Knightdale, NC
- 9,31552.3%Rescue & EMS
- 2,48013.9%Fire
- 2,10311.8%Hazardous Condition
- 1,5848.9%Good Intent Call
- 1,1886.7%False Alarm
- 1,1036.2%Service Call
- 330.2%Severe Weather
- Fire incident types reported to NFIRS in Knightdale, NC
- 96939.1%Structure Fires
- 93637.7%Outside Fires
- 46818.9%Mobile Property/Vehicle Fires
- 1074.3%Other
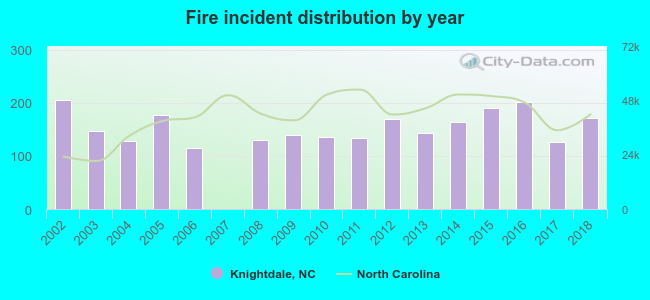 According to the data from the years 2002 - 2018 the average number of fire incidents per year is 146. The highest number of fires - 205 took place in 2002, and the least - 0 in 2007. The data has a declining trend.
The average number of yearly fire incidents per 10k residents in Knightdale, NC compared to nearest cities:
(Note: Based on data for the last 3 years, including only cities with population 5,000 and above)
| Knightdale: | 119.9 |
| Wendell: | 196.8 |
| Raleigh: | 24.8 |
| Rolesville: | 25.9 |
| Garner: | 53.3 |
| Clayton: | 129.0 |
| Wake Forest: | 42.9 |
| Cary: | 16.8 |
| Morrisville: | 25.0 |
 The median response time based on all reported fire incidents is 5 minutes. This is lower than the state median value.
The median response time in Knightdale, NC compared to nearest cities:
(Note: Based on data for all years, including only cities with at least 500 fire incidents)
| Knightdale: | 5 minutes |
| Wendell: | 6 minutes |
| Raleigh: | 5 minutes |
| Garner: | 5 minutes |
| Clayton: | 8 minutes |
| Zebulon: | 6 minutes |
| Wake Forest: | 6 minutes |
| Middlesex: | 9 minutes |
| Youngsville: | 9 minutes |
 Based on the reports from the years 2002 - 2018 the average number of fire-related casualties per year is 2. The highest number of reported casualties - 7 took place in 2014, and the lowest - 0 in 2003. The data has a dropping trend.
The average number of casualties per 1,000 fires is 12. This indicator was the highest - 46 in 2008, and the lowest 0 in 2003. The trend for casualties per 1,000 fires is declining. Compared to the North Carolina value the number of injuries per 1,000 fire incidents is higher.
Based on the reports from the years 2002 - 2018 the average number of fire-related casualties per year is 2. The highest number of reported casualties - 7 took place in 2014, and the lowest - 0 in 2003. The data has a dropping trend.
The average number of casualties per 1,000 fires is 12. This indicator was the highest - 46 in 2008, and the lowest 0 in 2003. The trend for casualties per 1,000 fires is declining. Compared to the North Carolina value the number of injuries per 1,000 fire incidents is higher.Casualties per 1,000 incidents in Knightdale, NC compared to nearest cities:
(Note: Based on data for all years, including only cities with at least 500 fire incidents)
| Knightdale: | 12.1 |
| Wendell: | 1.1 |
| Raleigh: | 7.0 |
| Garner: | 2.4 |
| Clayton: | 0.5 |
| Zebulon: | 2.6 |
| Wake Forest: | 2.2 |
| Middlesex: | 0.0 |
| Youngsville: | 0.0 |
 25.5% incidents where reported in the morning and 74.5% in the evening. The most fires (15.9%) took place on Saturday, and the least (11.3%) on Tuesday.
 According to the 2,480 fire incident reports from years 2002 - 2018 most fires (10.8%) took place during April, and the least (6.9%) in September.
 Out of all 17,824 cases reported during the years 2002 - 2018, the most belonged to the categories: Rescue & EMS (52.3%), Fire (13.9%), and Hazardous Condition (11.8%).
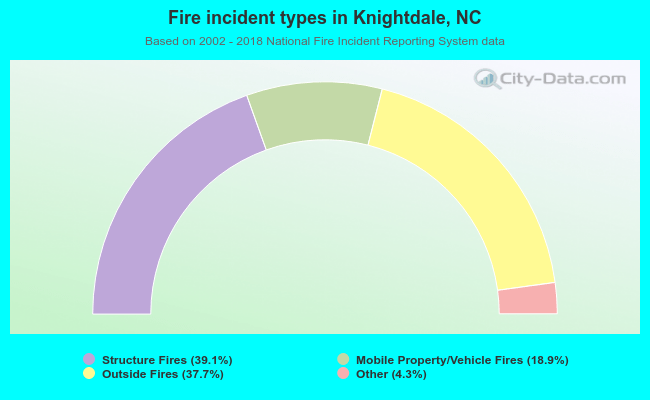 When looking into fire subcategories, the most incidents belonged to: Structure Fires (39.1%), and Outside Fires (37.7%).