Montgomery: Fire Incidents, Alabama (AL)
Where are fire incidents reported in Montgomery, AL
Something went wrong! Please refresh the page.
| Fire incidents reported | |
|---|---|
| Sreet name | Count |
| SOUTH BLVD | 345 |
| ATLANTA HWY | 205 |
| EASTERN BLVD | 195 |
| I85 SOUTHBOUND | 140 |
| WARES FERRY RD | 135 |
| TROY HWY | 130 |
| WOODLEY RD | 130 |
| COURT ST | 125 |
| NORMAN BRIDGE RD | 125 |
| MOBILE HWY | 105 |
| FAIRVIEW AVE | 100 |
| I65 NORTHBOUND | 100 |
| CARTER HILL RD | 95 |
| OAK ST | 95 |
| NARROW LANE RD | 90 |
| BURBANK DR | 85 |
| I85 NORTHBOUND | 85 |
| OLD SELMA RD | 85 |
| ROSA L PARKS AVE | 85 |
| WETUMPKA HWY | 84 |
| EASTCHASE PKY | 80 |
| CARMICHAEL RD | 75 |
| I65 SOUTHBOUND | 75 |
| I-85 SOUTH | 70 |
| LONGVIEW CT | 70 |
| TAYLOR RD | 70 |
| VAUGHN RD | 70 |
| I-85 | 65 |
| LOCUST ST | 65 |
| SELMA HWY | 65 |
2006 - 2018 National Fire Incident Reporting System (NFIRS) incidents
- Incident types reported to NFIRS in Montgomery, AL
- 90,76275.9%Rescue & EMS
- 12,36110.3%Good Intent Call
- 7,9106.6%False Alarm
- 3,3402.8%Service Call
- 3,1332.6%Fire
- 1,8141.5%Hazardous Condition
- 1630.1%Overpressure Rupture
- Fire incident types reported to NFIRS in Montgomery, AL
- 1,23639.5%Outside Fires
- 1,04433.3%Structure Fires
- 67121.4%Mobile Property/Vehicle Fires
- 1825.8%Other
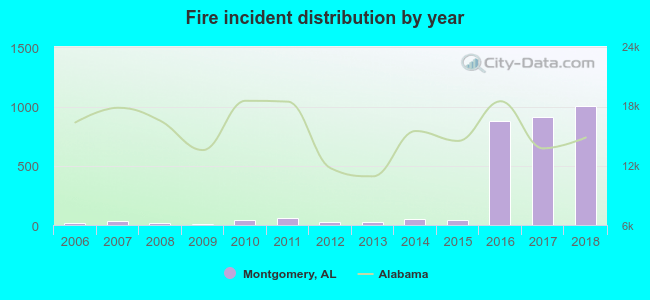 According to the data from the years 2006 - 2018 the average number of fires per year is 241. The highest number of reported fire incidents - 1,008 took place in 2018, and the least - 11 in 2009. The data has a rising trend.
The average number of yearly fire incidents per 10k residents in Montgomery, AL compared to nearest cities:
(Note: Based on data for the last 3 years, including only cities with population 5,000 and above)
| Montgomery: | 46.5 |
| Hope Hull: | 3.4 |
| Pike Road: | 57.1 |
| Millbrook: | 27.7 |
| Prattville: | 34.6 |
| Wetumpka: | 110.1 |
| Titus: | 2.0 |
| Marbury: | 10.1 |
| Clanton: | 160.4 |
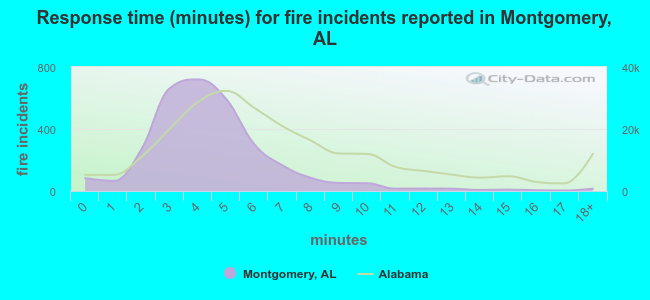 The median response time based on all reported fire incidents is 4 minutes. This is lower compared to the state median value.
The median response time in Montgomery, AL compared to nearest cities:
(Note: Based on data for all years, including only cities with at least 500 fire incidents)
| Montgomery: | 4 minutes |
| Millbrook: | 5 minutes |
| Prattville: | 6 minutes |
| Wetumpka: | 7 minutes |
| Eclectic: | 9 minutes |
| Tallassee: | 10 minutes |
| Clanton: | 7 minutes |
| Greenville: | 6 minutes |
| Troy: | 5 minutes |
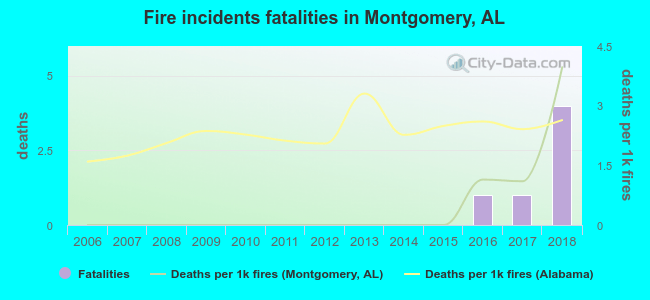 Based on the reports from the years 2006 - 2018 the average number of fire-related fatalities per year is 0. The highest number of deaths - 4 took place in 2018, and the lowest - 0 in 2006. The data has an increasing trend.
The average number of fatalities per 1,000 fire incidents is 0. This indicator was the highest - 4 in 2018, and the lowest 0 in 2006. The trend for deaths per 1,000 incidents is rising. Compared to the state value the number of deaths per 1,000 incidents is similar.
Based on the reports from the years 2006 - 2018 the average number of fire-related fatalities per year is 0. The highest number of deaths - 4 took place in 2018, and the lowest - 0 in 2006. The data has an increasing trend.
The average number of fatalities per 1,000 fire incidents is 0. This indicator was the highest - 4 in 2018, and the lowest 0 in 2006. The trend for deaths per 1,000 incidents is rising. Compared to the state value the number of deaths per 1,000 incidents is similar.Deaths per 1,000 incidents in Montgomery, AL compared to nearest cities:
(Note: Based on data for all years, including only cities with at least 2,500 fire incidents)
| Montgomery: | 1.9 |
| Selma: | 2.7 |
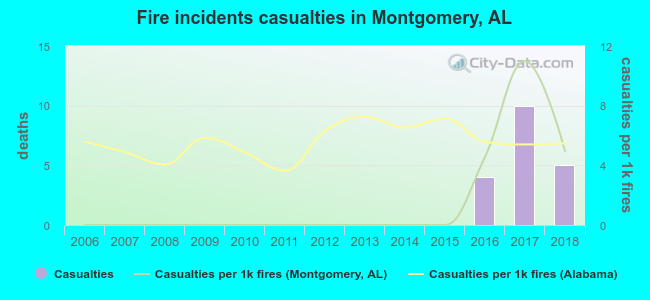 According to the data from the years 2006 - 2018 the average number of fire-related yearly casualties is 1. The highest number of reported injuries - 10 took place in 2017, and the lowest - 0 in 2006. The data has a rising trend.
The average number of casualties per 1,000 fire incidents is 2. This indicator was the highest - 11 in 2017, and the lowest 0 in 2006. The trend for injuries per 1,000 fire incidents is rising. Compared to the Alabama value the number of casualties per 1,000 fires is similar.
According to the data from the years 2006 - 2018 the average number of fire-related yearly casualties is 1. The highest number of reported injuries - 10 took place in 2017, and the lowest - 0 in 2006. The data has a rising trend.
The average number of casualties per 1,000 fire incidents is 2. This indicator was the highest - 11 in 2017, and the lowest 0 in 2006. The trend for injuries per 1,000 fire incidents is rising. Compared to the Alabama value the number of casualties per 1,000 fires is similar.Casualties per 1,000 incidents in Montgomery, AL compared to nearest cities:
(Note: Based on data for all years, including only cities with at least 500 fire incidents)
| Montgomery: | 6.1 |
| Millbrook: | 1.6 |
| Prattville: | 6.7 |
| Wetumpka: | 4.8 |
| Eclectic: | 1.7 |
| Tallassee: | 1.9 |
| Clanton: | 8.0 |
| Greenville: | 3.9 |
| Troy: | 6.3 |
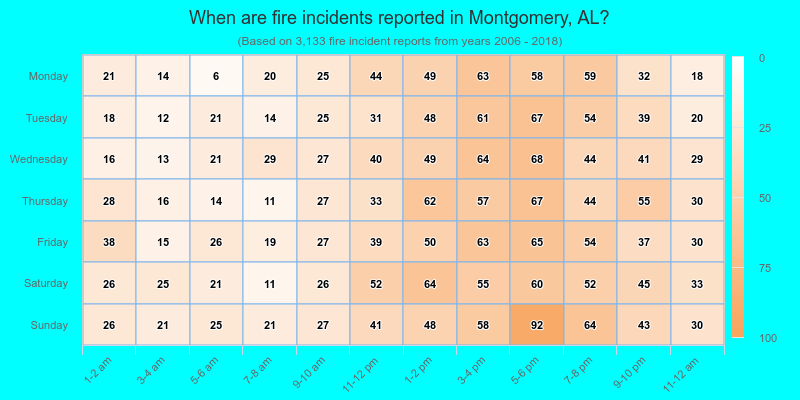
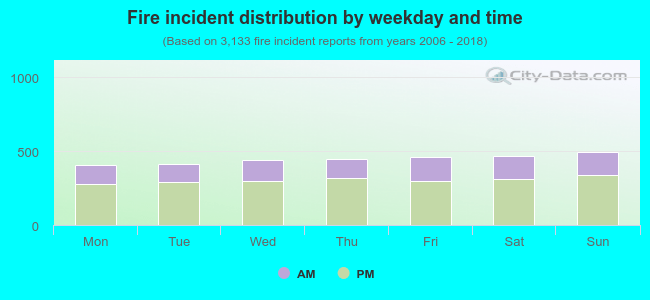 32.3% incidents where reported in the morning and 67.7% in the evening. The most fires (15.8%) took place on Sunday, and the least (13.1%) on Monday.
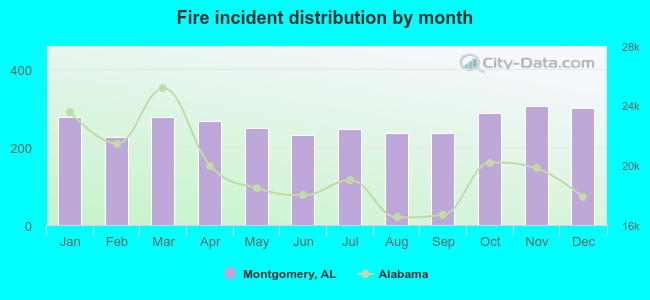 According to the 3,133 fires from years 2006 - 2018 most fires (9.8%) took place during November, and the least (7.2%) in February.
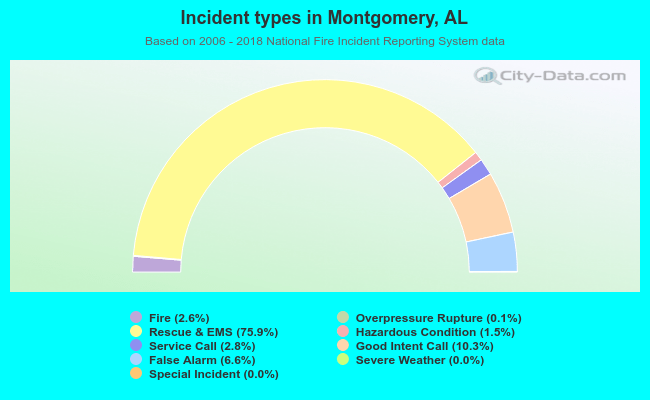 Out of all 119,544 cases reported during the years 2006 - 2018, the most belonged to the categories: Rescue & EMS (75.9%), Good Intent Call (10.3%), and False Alarm (6.6%).
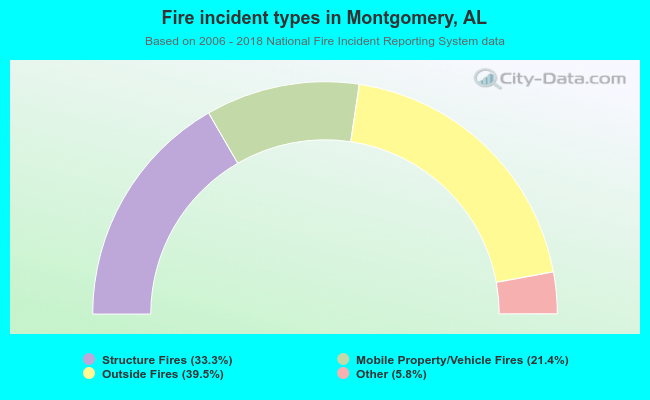 When looking into fire subcategories, the most reports belonged to: Outside Fires (39.5%), and Structure Fires (33.3%).